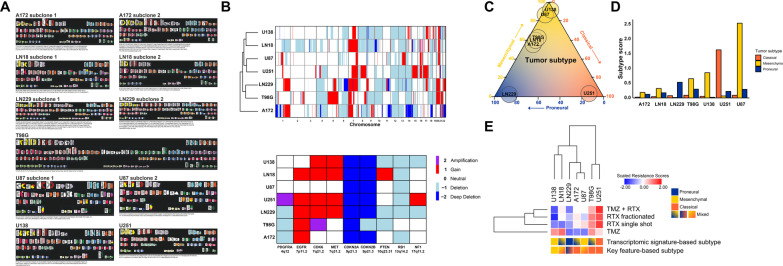
Fig. 2.
Molecular subtyping of human glioblastoma cell lines. a Spectral karyotyping (SKY FISH) analyses of human glioblastoma cell lines. SKY FISH analyses were performed as previously described [15]. Karyotypes were described according to the international system of human cytogenetic nomenclature (ISCN, edition 2013) [16]. For cell lines A172, LN18, LN229, and U87, two distinct cytogenetic subclones are shown each. b Array comparative genomic hybridization (aCGH) analysis of glioblastoma cell lines. Hierarchical clustering of genomic copy number calls of chromosomes 1–22 in glioblastoma cell lines (top), and copy number status of gene loci with known association to glioblastoma subtypes (bottom). Copy number gains (up to 4 copies) are depicted by red bars, copy number amplifications (> 4 copies) by purple bars, and copy number losses by light blue (1 copy), and dark blue (complete loss), respectively. c Ternary plot of molecular subtyping of human glioblastoma cell lines on basis of mRNA expression of subtype-related signature genes (according to Wang et al. [23]), obtained by ssGSEA. The proneural subtype is depicted in blue, the classical subtype is depicted in orange, and the mesenchymal subtype is depicted in yellow. Values for subtypes were scaled to sum of 100% per cell line. d Bar plots of molecular subtype scores. e Graphical presentation of molecular subtypes of human glioblastoma cell lines as revealed by transcriptomic signature-based (top) and key feature-based subtyping (bottom), respectively. Scores of inherent therapy resistance are depicted by unsupervised hierarchical clustering

