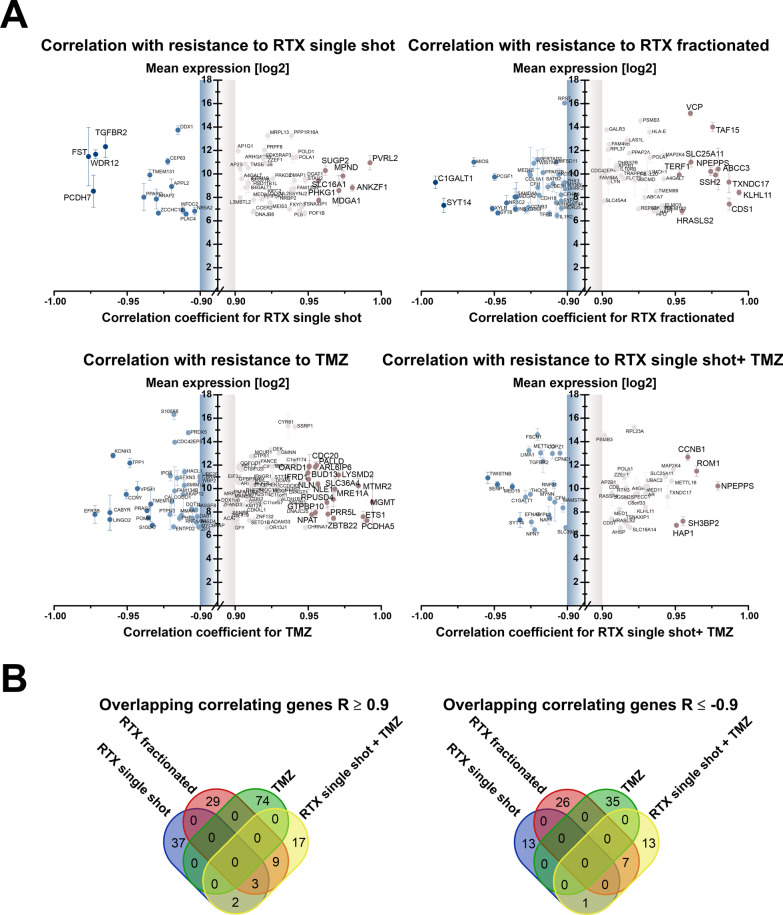
Fig. 3.
Integration of global mRNA expression data with scores of inherent therapy resistance in human glioblastoma cell lines. a Graphical representation of genes whose log2 mRNA expression levels show strong positive or negative correlation (|R|≥ 0.9) with inherent resistance to single-shot RTX, fractionated RTX, TMZ, and single-shot RTX + TMZ in human glioblastoma cell lines. Only genes with an average log2 expression value of 6 or higher compared to astrocytes are shown. b Intersect analysis of genes whose log2 mRNA expression shows significant positive or negative correlation (|R|≥ 0.9) with inherent resistance to single-shot RTX (blue), fractionated RTX (red), TMZ (green), and single-shot RTX + TMZ (yellow)

