Fig. 9.
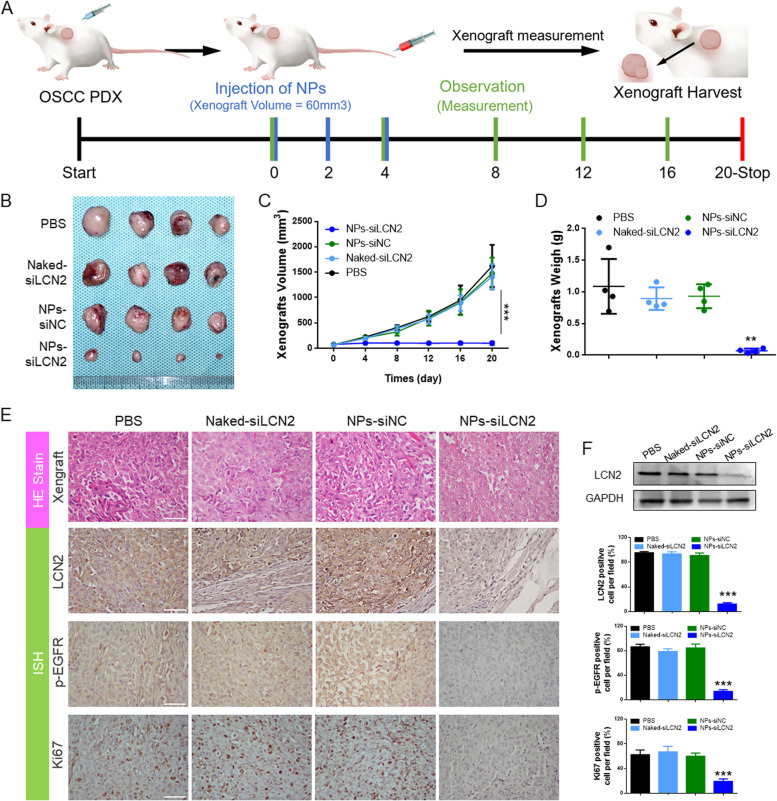
A Schematic diagram of the treatment of an OSCC PDX model. Three cycles of intravenous injection of NPs and 6 observations were applied when the tumor volume was approximately 60 mm3. B Photographs of collected xenografts on Day 20. Among the groups, the NPs-siLCN2 group displayed the smallest xenografts. C Tumor proliferation in each group. The inhibition of tumor growth was significant in the NPs-siLCN2 group compared to that in the other groups. D Comparison of tumor weight on the last day (Day 20). E Histological detection of HE, LCN2, p-EGFR and Ki67 in the tumor tissues; the results suggested that when LCN2 was inhibited, p-EGFR and Ki67 expression was reduced. (Scale bar: 50 μm). F Immunoblot detection of tumor homogenates. The results showed that LCN2 expression was downregulated in tumors from the nano-siLCN2 group

