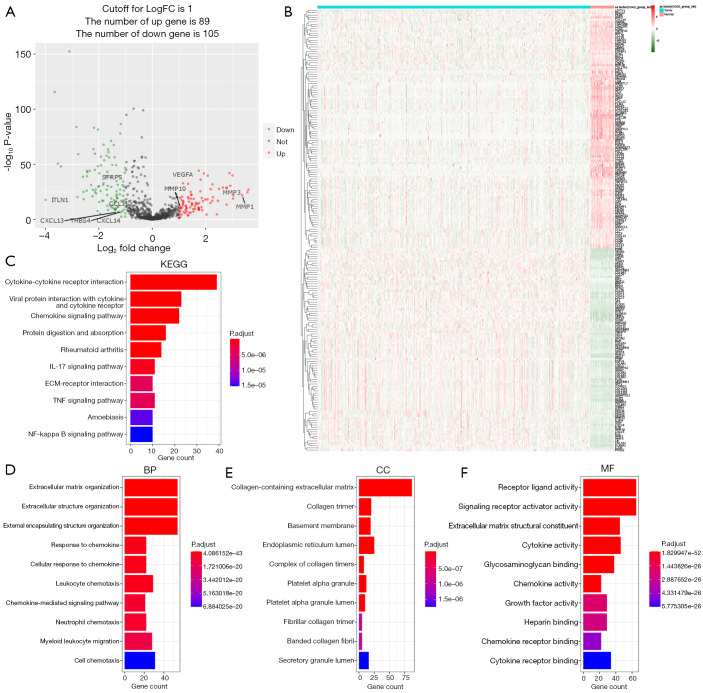
Figure 2.
Functional enrichment analysis of the identified differentially expressed ECM-related genes in TCGA-COAD cohort. (A) Volcano plot of identified differentially expressed ECM-related genes. Green dots represent 105 downregulated genes; red dots represent 89 upregulated genes. Venn diagram shows the intersection of differentially expressed genes and ECM-related genes. (B) Heatmap of identified differentially expressed ECM-related genes. Green represents downregulation, and red represents upregulation of genes. (C) Top 10 enriched KEGG pathways terms of differentially expressed ECM-related genes. (D-F) Top 10 enriched biological processes, molecular functions, cellular components terms of differentially expressed ECM-related genes. ECM, extracellular matrix; TCGA, The Cancer Genome Atlas; COAD, colon adenocarcinoma; KEGG, Kyoto Encyclopedia of Genes and Genomes; GO, gene ontology. BP, biological process; CC, cellular Component; MF, molecular function.

