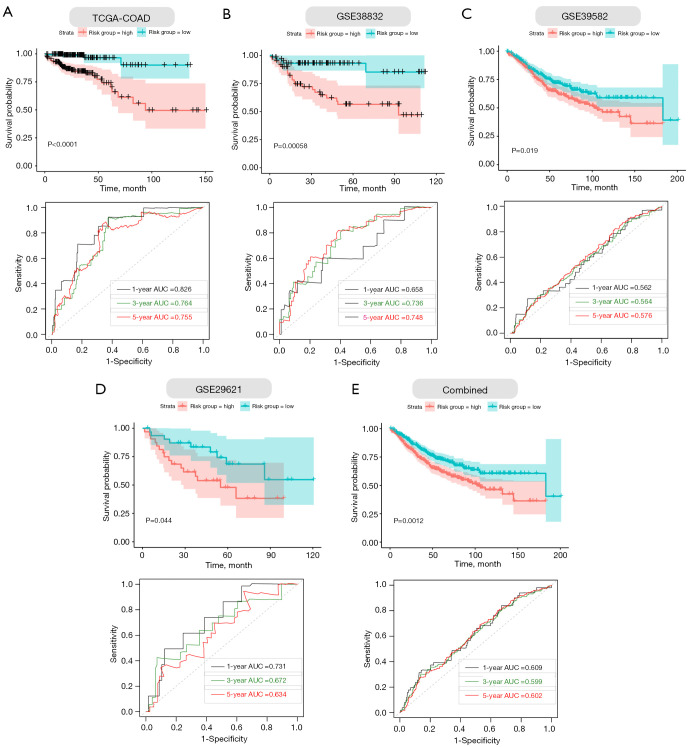
Figure 5.
Validation of the four gene ECM-based prognostic signature in training and validation cohorts. (A-E, upper panels) Kaplan-Meier survival curves show that the survival time of the high-risk groups are significantly shorter than that of the low-risk score groups in COAD and validation cohorts. (A-E, lower panels) Time-dependent ROC curves for the prognostic performance of the ECM-based signature in COAD and validation cohorts. ECM, extracellular matrix; TCGA, The Cancer Genome Atlas; COAD, colon adenocarcinoma; ROC, receiver-operating characteristic, AUC, area under the curve.

