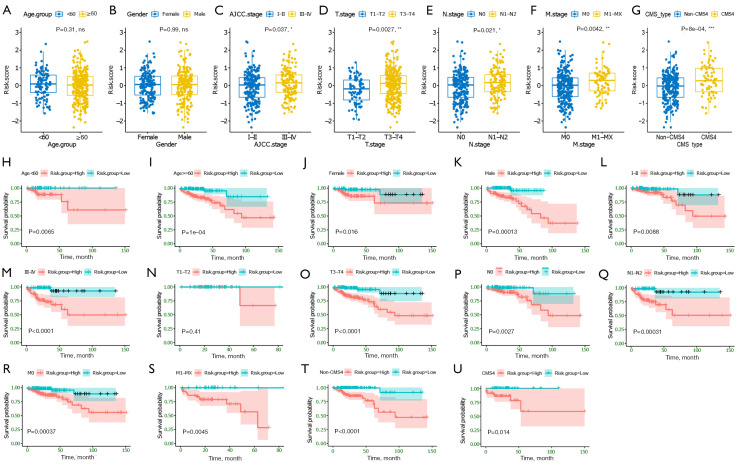
Figure 6.
Association between the established four gene ECM-based signature and clinical features. (A-G) Correlation analyses of risk scores calculated based on the ECM-based signature with multiple clinical features of CC patients in the COAD cohort, including age, gender, AJCC stage, T stage, N stage, M stage, and CMSs. (H-U) Subgroup Kaplan-Meier curve analysis shows overall survival probability of high- and low-risk CC patients from the COAD cohort stratified by age (<60, ≥60), gender (female, male), AJCC stage (stage I/II, stage III/IV), T stage (T1-T2, T3-T4), N stage (N0, N1-T2), M stage (M0, M1-MX). Statistical significance was calculated using the log-rank test. *, P<0.05; **, P<0.01; and ***, P<0.001. ECM, extracellular matrix; COAD, colon adenocarcinoma; AJCC, American Joint Committee on Cancer; CMS subtype, consensus molecular subtype; T stage, Tumor stage; N stage, Nodal Involvement stage; M stage, Metastasis stage.

