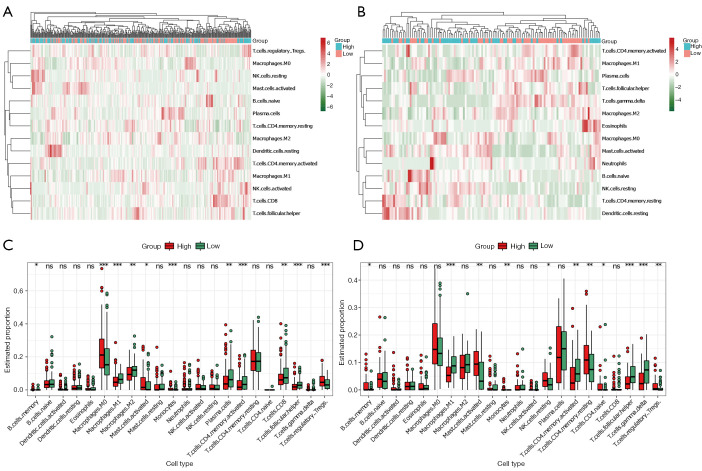
Figure 8.
Immune cell infiltration analysis. (A,B) Heatmaps showing the unsupervised cluster analysis of each immune cell proportion in COAD and GSE38832 cohorts. (C,D) Distribution level of 22 types of immune cells in the high- and low-risk groups in COAD and GSE38832 cohorts. * P<0.05; **, P<0.01; and ***, P<0.001, ns, not significant. COAD, colon adenocarcinoma.

