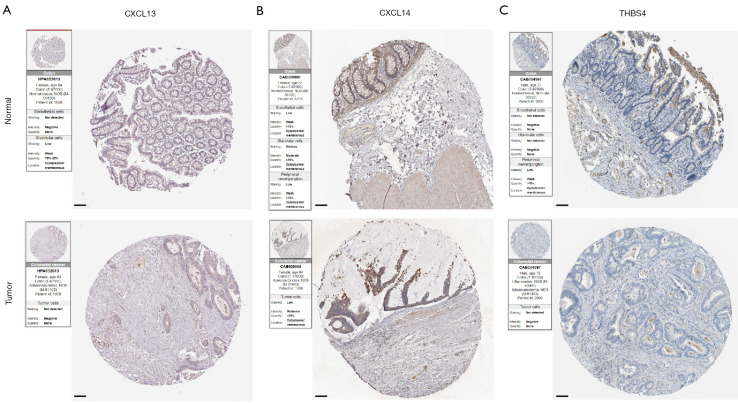
Figure 9.
Representative immunohistochemistry images of (A) CXCL13, (B) CXCL14 and (D) THBS4 in both normal and CC tissues sourced from the Human Protein Atlas database (https://www.proteinatlas.org/). Image credit goes to the Human Protein Atlas. The links to the individual normal and tumor tissues of each protein are provided for CXCL13 (https://www.proteinatlas.org/ENSG00000156234-CXCL13/tissue/Colon#img; https://www.proteinatlas.org/ENSG00000156234-CXCL13/pathology/colorectal+cancer#img), CXCL14 (https://www.proteinatlas.org/ENSG00000145824-CXCL14/tissue/Colon#img; https://www.proteinatlas.org/ENSG00000145824-CXCL14/pathology/colorectal+cancer#img), and THBS4 (https://www.proteinatlas.org/ENSG00000113296-THBS4/tissue/Colon#img; https://www.proteinatlas.org/ENSG00000113296-THBS4/pathology/colorectal+cancer#img), respectively. Scale bar, 100 μm. CC, colon cancer.

