
Extended Data Fig. 9: Prostate cancer and breast cancer risk heritability attributable to germline variation within prostate tumor chromatin states.
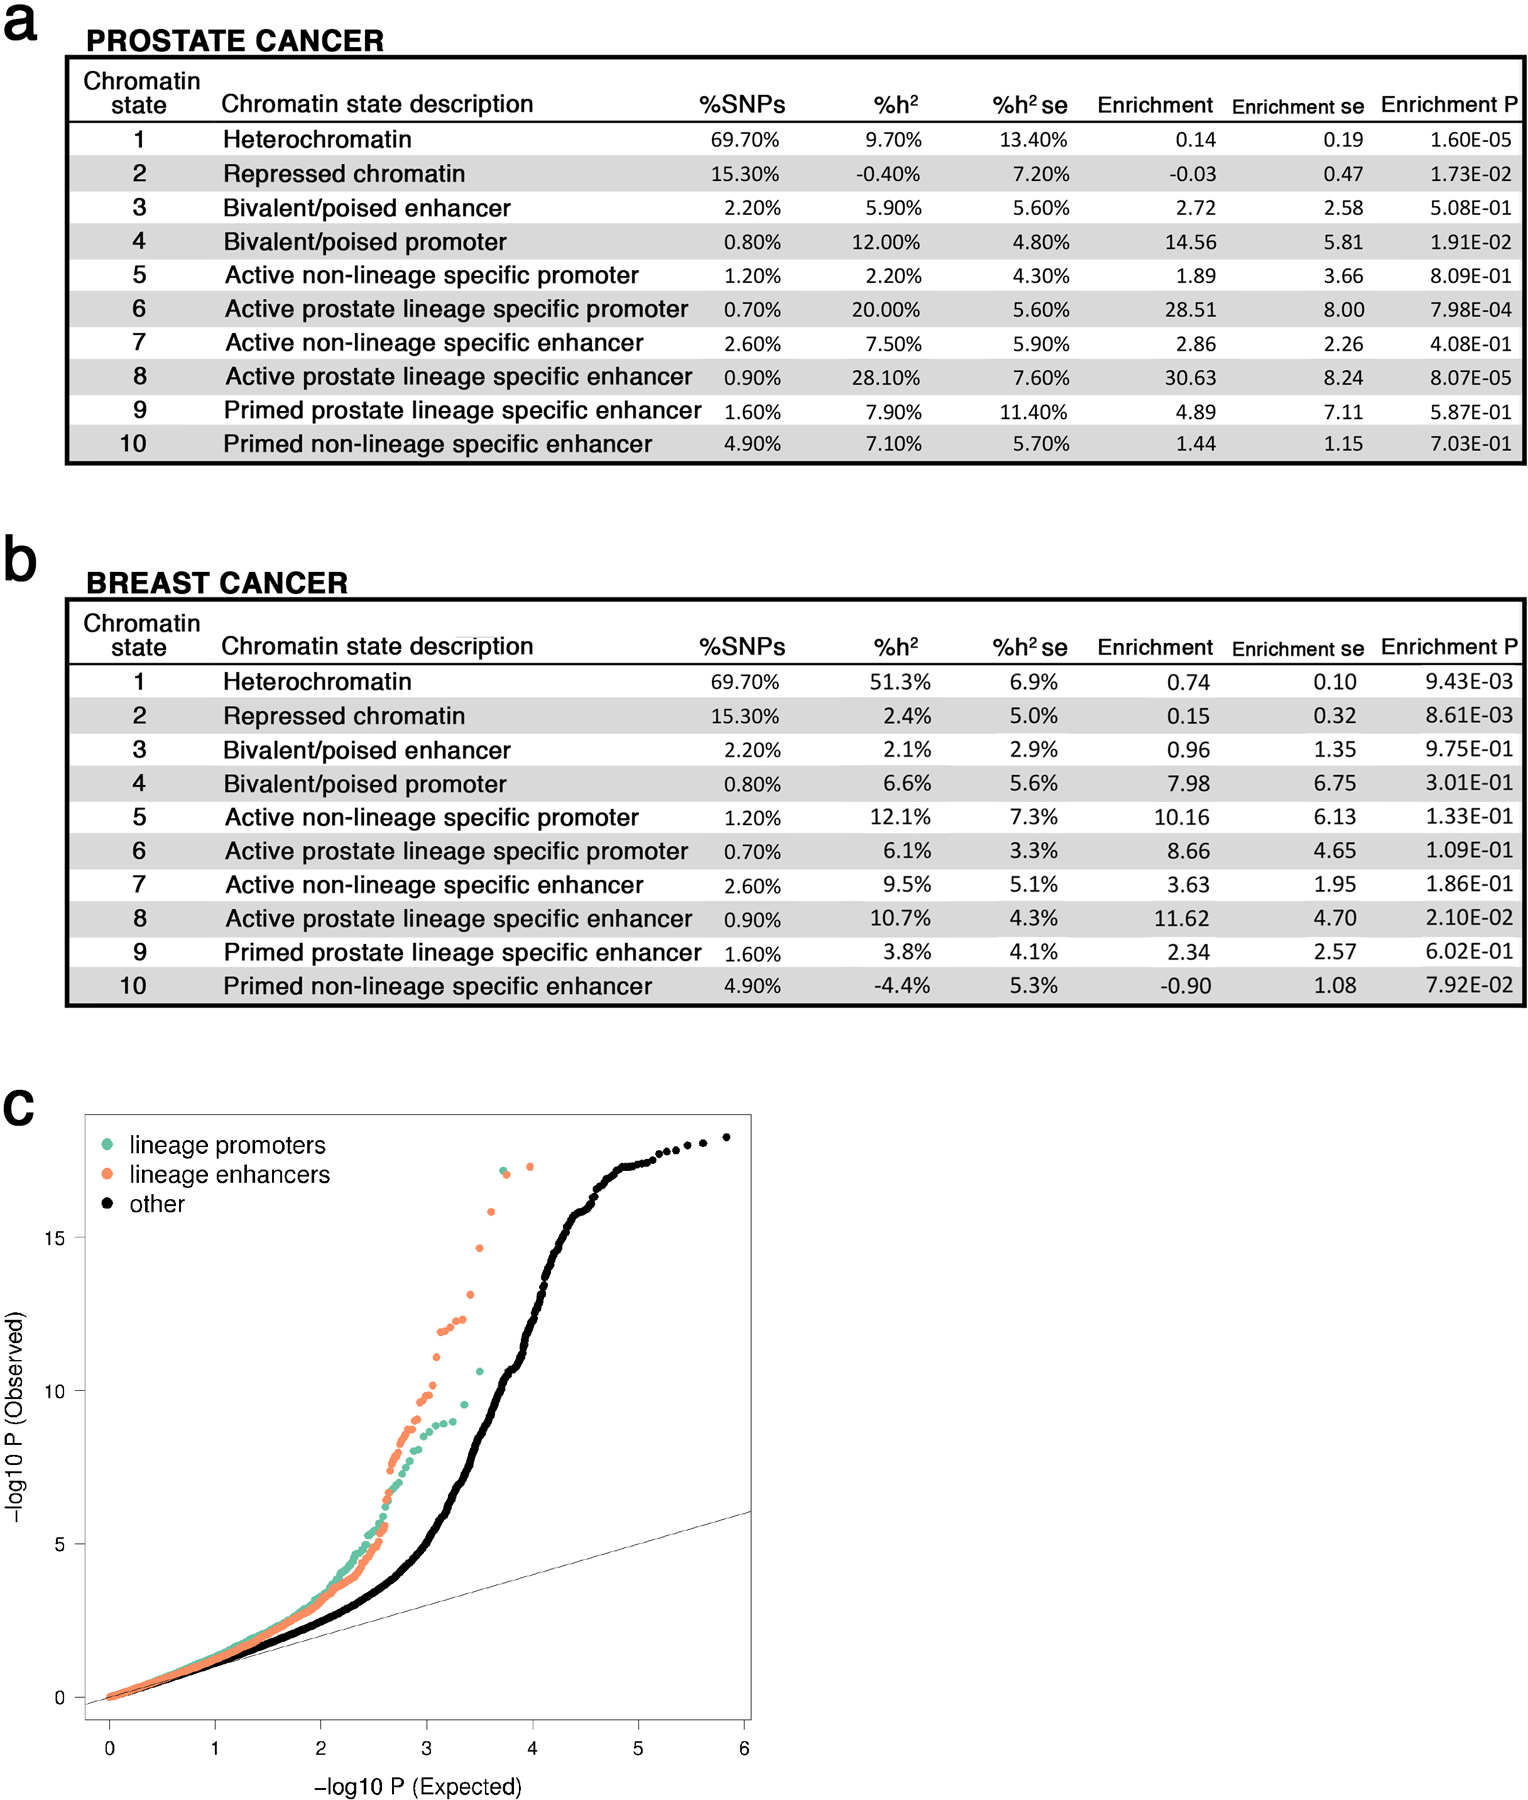
(a) Prostate cancer heritability attributable to each prostate cancer chromHMM state. (b) Breast cancer heritability attributable to each prostate cancer chromHMM state. %SNPs: percentage of single nucleotide polymorphisms residing within a chromatin state; %h2: proportion of prostate cancer risk heritability; se: standard error; Enrichment: heritability based on overall proportion of SNPs within the chromatin state. ( c) Q-Q Plot of PCa risk GWAS statistics in lineage specific and non-specific features. Lineage specific promoters, enhancers, and all other variants shown in green, orange, and black respectively. Variants with Chi-squared statistic > 80 were removed, as recommend by LD-score regression to mitigate outliers. Across all variants, mean Chi-squared statistic was 1.6 (s.e. 0.04), 1.7 (s.e. 0.07), and 1.2 (s.e. 0.003) for variants in promoters, enhancers, and all variants.