
Extended Data Fig. 10: Prostate cancer somatic mutations are enriched at prostate lineage specific sites.
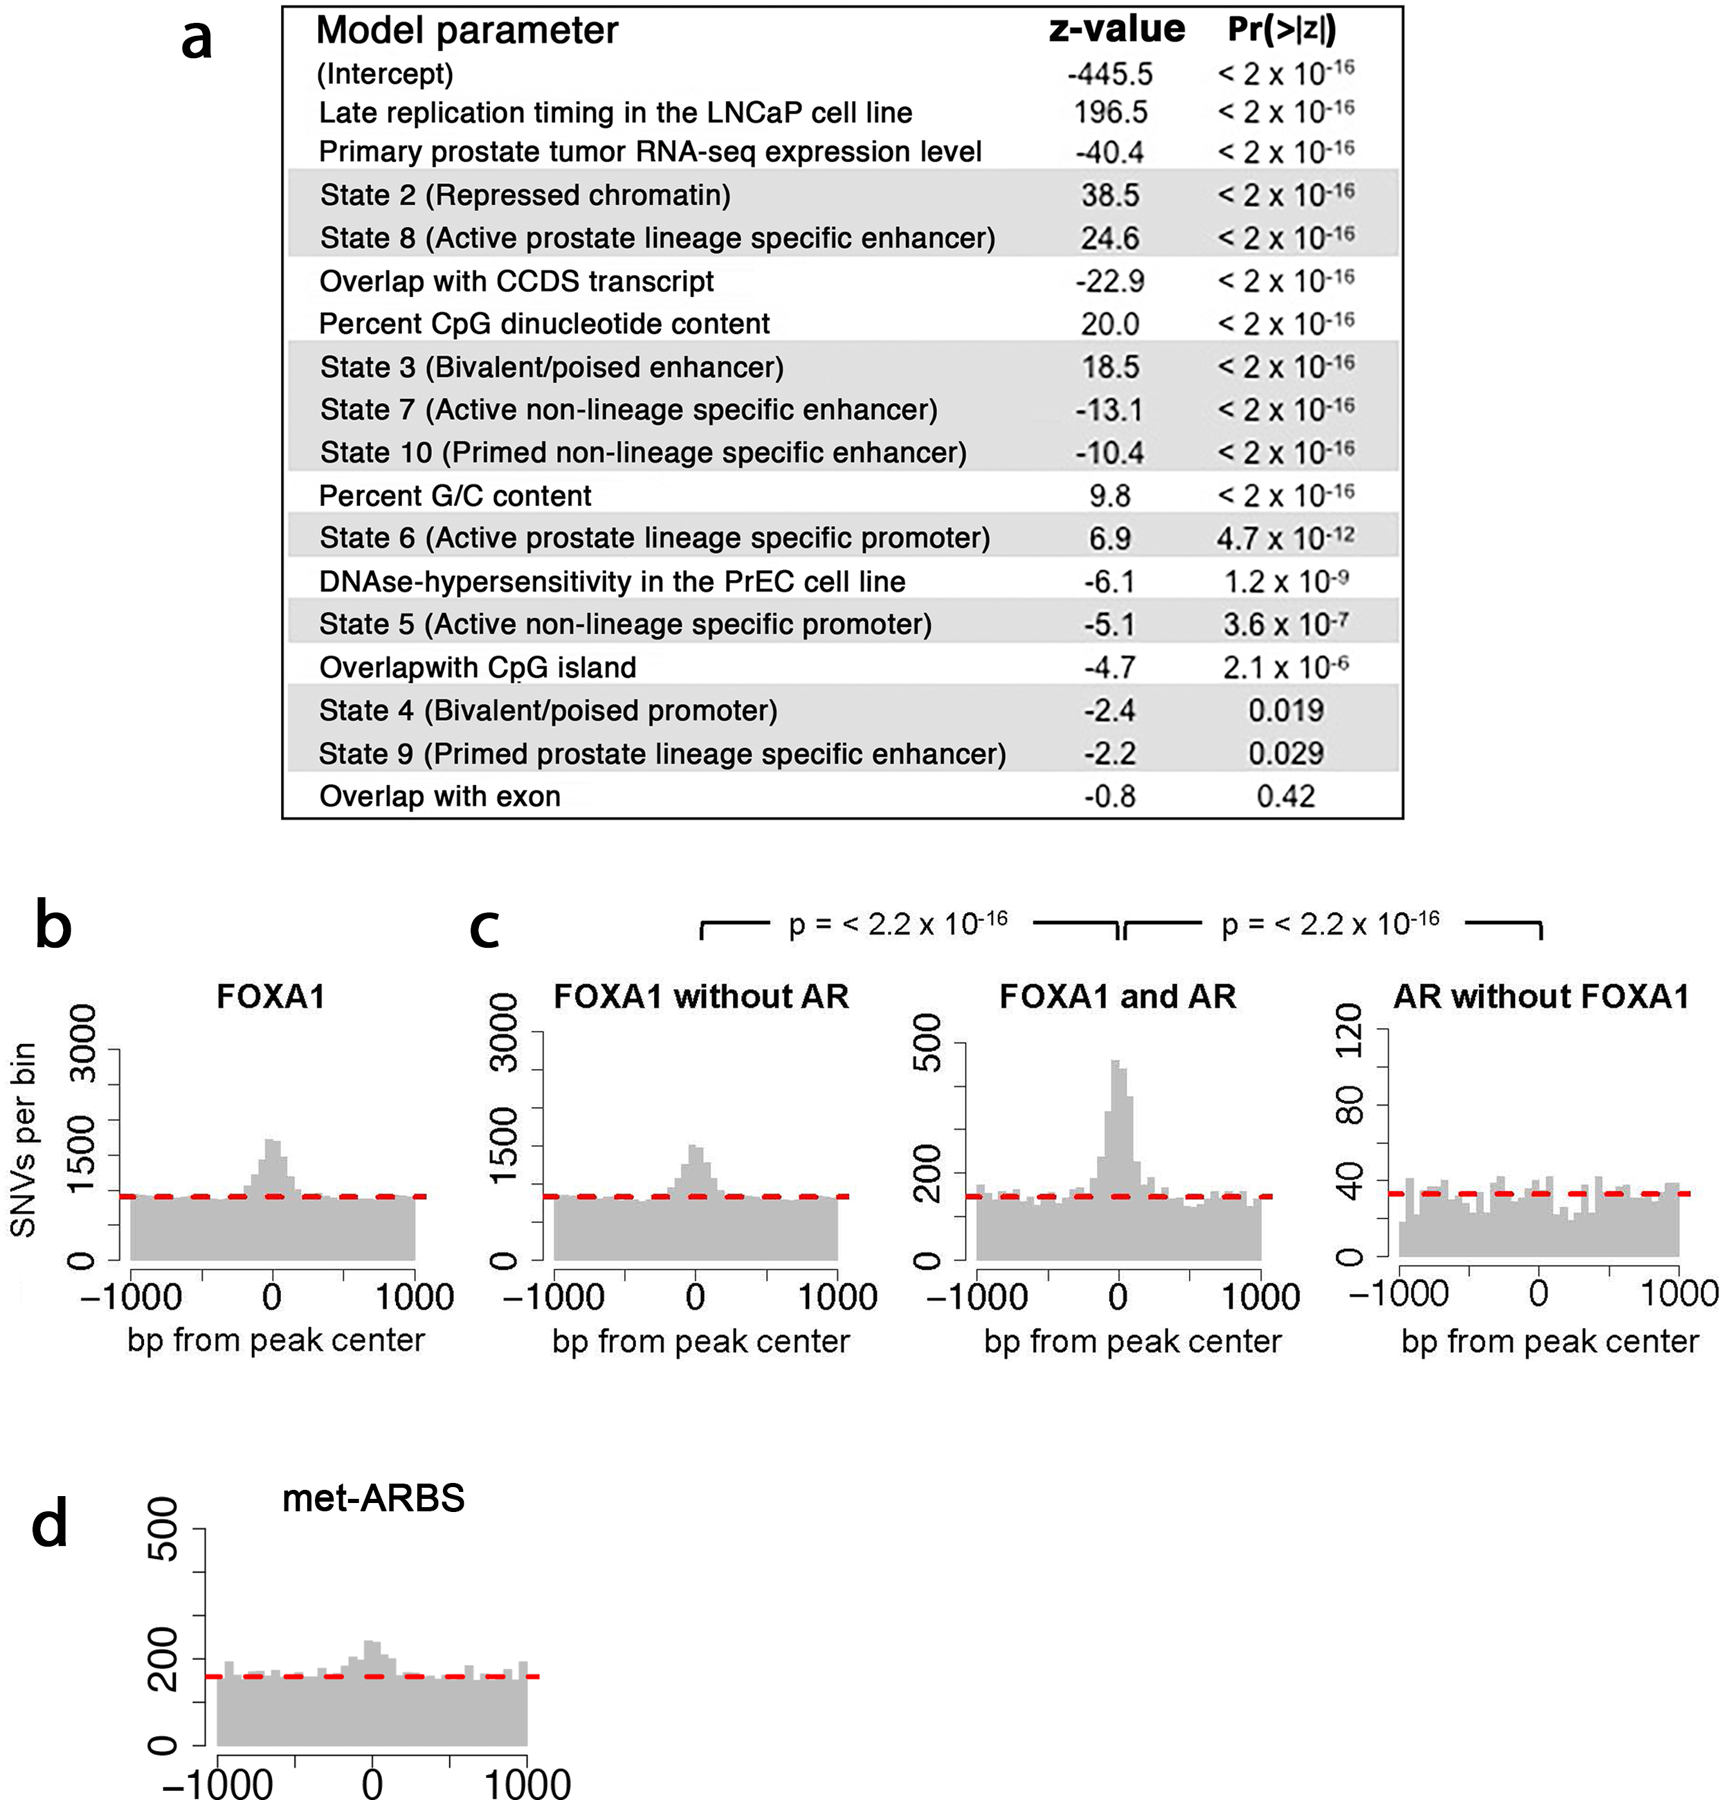
(a) Rank-ordered terms in a linear model of somatic mutation density in prostate cancer. Using 210 prostate cancer whole genome sequences from the International Cancer Genome Consortium, the number of donors with one or more mutations per 200bp window was modeled as a poisson distribution determined by a linear combination of the listed factors. Beta coefficients for each term were calculated and are reported as standardized Z-scores to allow comparison. ChromHMM states are highlighted in gray. See methods for details and a listing of datasets used in the model. (b) SNV distribution at FOXA1 binding sites in prostate tumor tissue. (C) SNV distribution at FOXA1 binding sites with no overlapping AR peak in prostate tumors (left), at intersection of FOXA1 and AR tumor peaks (center), and at AR tumor binding sites without overlapping FOXA1 peaks. P-values compare differential enrichment by Pearson’s chi-square test of mutation counts at the peak (±250bp) and shoulder regions (-1000 to -250 and 250 to 1000) of the TF binding sites. (d) SNV distribution at met-ARBS.