
Extended Data Fig. 1: Co-occupancy of AR and H3K27Ac at met-ARBS.
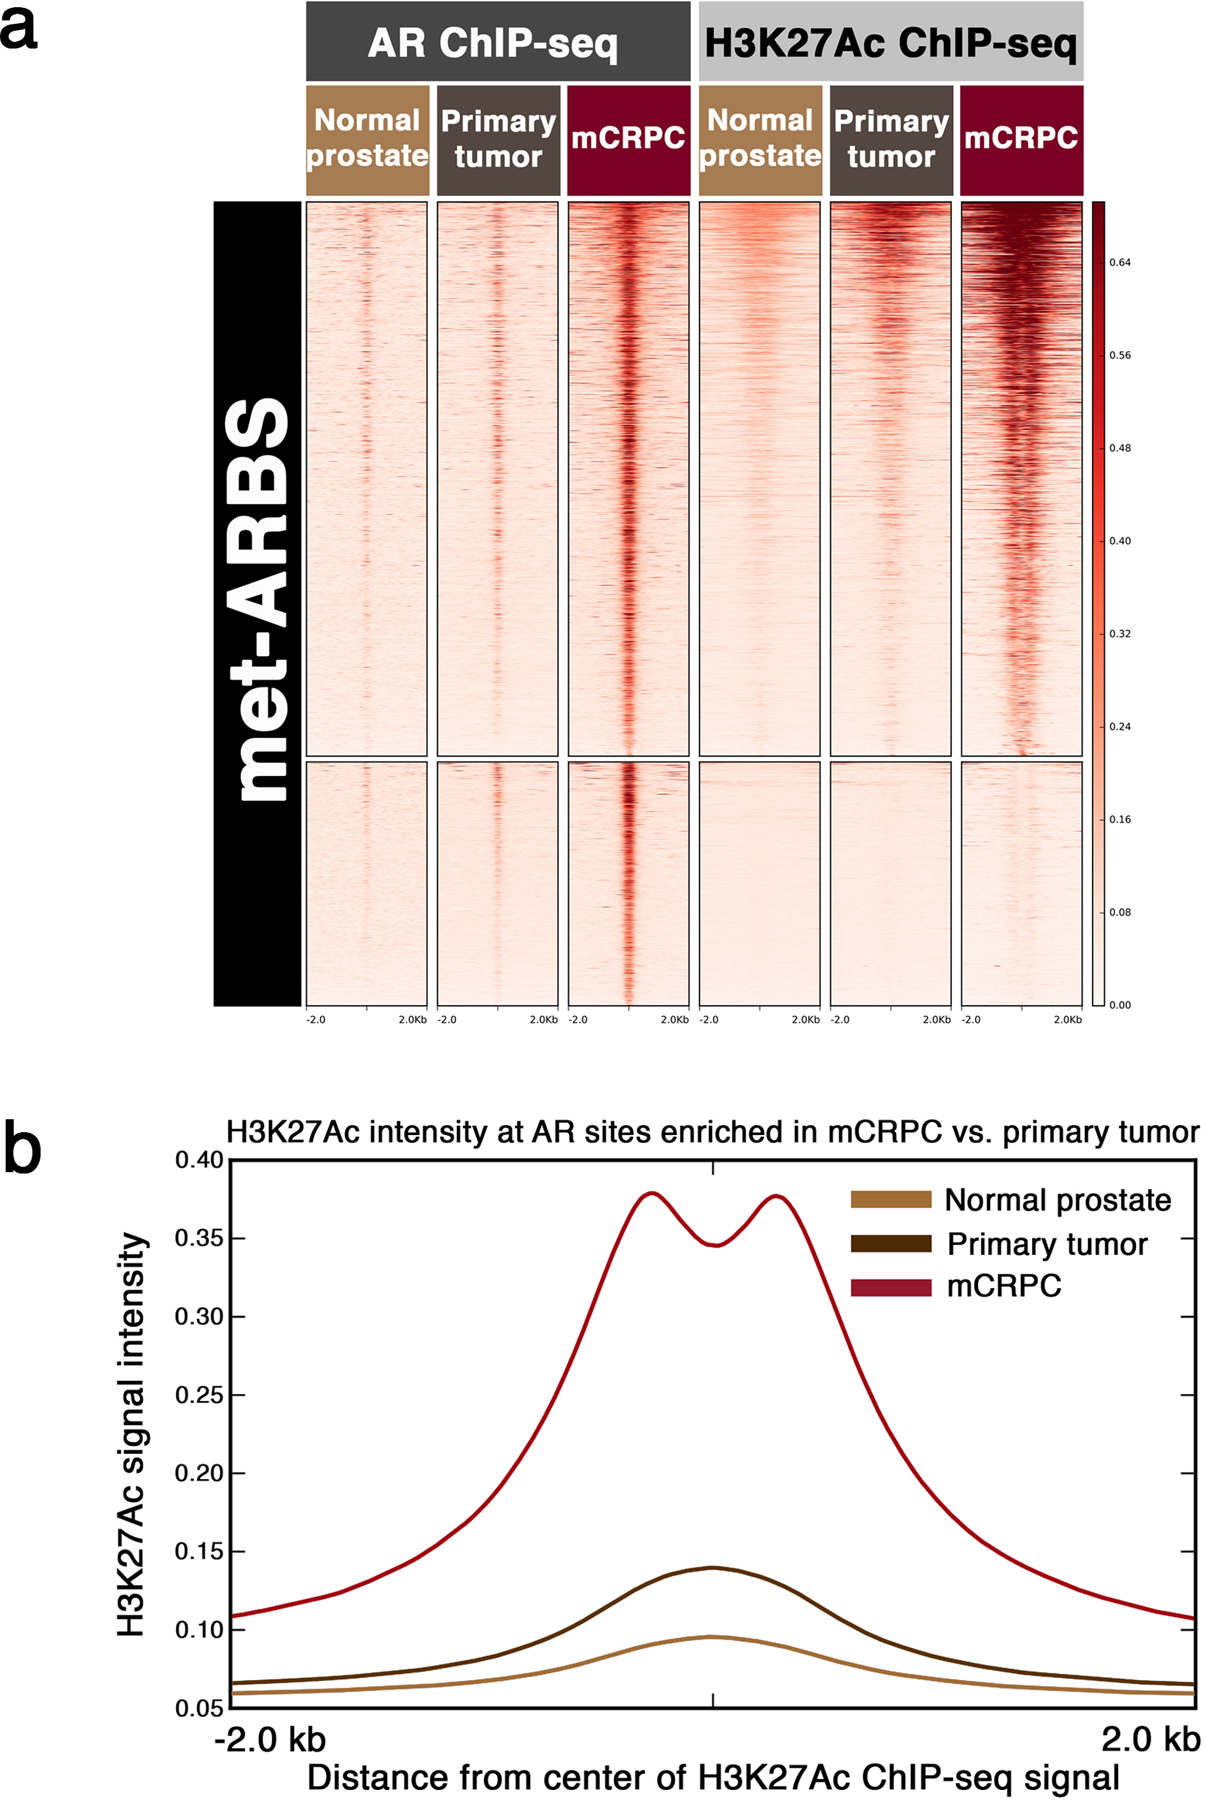
(a) Heatmaps for AR and H3K27Ac ChIP-seq signal intensity at met-ARBS. Each horizontal line represents a four kilobase (kb) locus. Shade of red reflects average binding intensity at that site across all subjects in the normal prostate, primary tumor and mCRPC cohorts. (b) H3K27Ac ChIP-seq signal intensity across tissue types at the 17,655 met-ARBS. The curves depict overall signal in each of the three tissue types. Signal significantly higher in mCRPC compared with primary prostate tumor and normal prostate tissue (Kolmogorov-Smirnov test, D^- = 0.74, p-value < 2.2e-16).