
Extended Data Fig. 3: Reprogrammed AR binding sites in primary prostate tumors and in mCRPC are epigenetically pre-marked in earlier states.
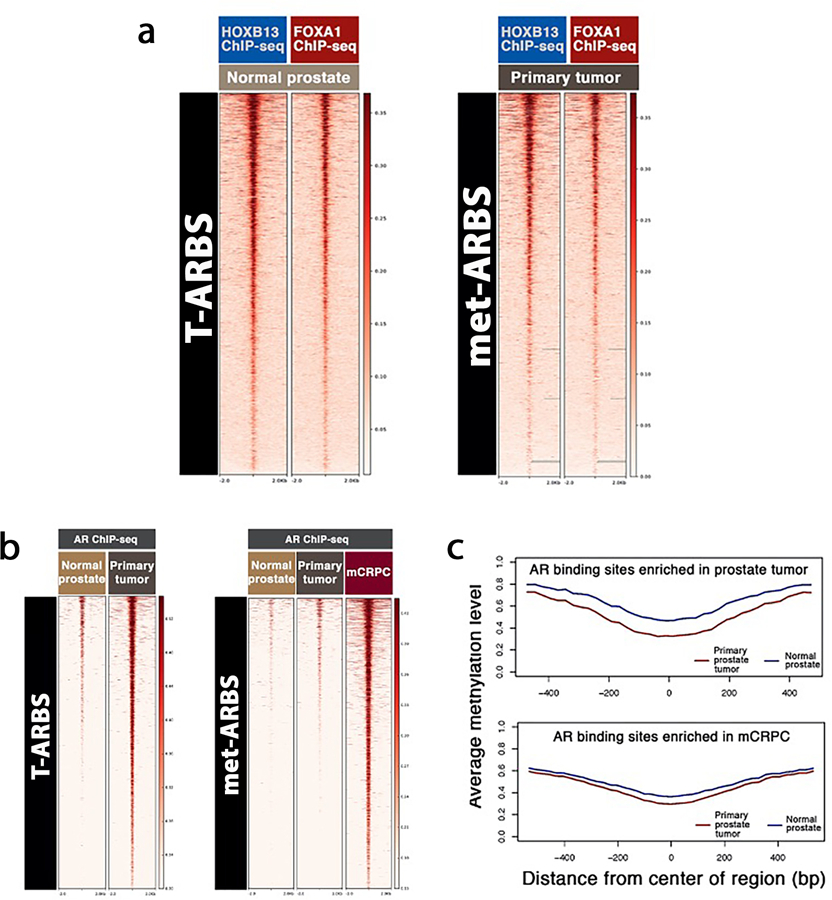
(a) Heat map indicating HOXB13 and FOXA1 ChIP-seq signal intensity in normal prostate epithelium and primary prostate tumor in the NKI dataset. At left, the 9,179 AR sites enriched in primary tumor relative to normal prostate epithelium (T-ARBS). At right, the 17,655 AR sites enriched in mCRPC relative to primary tumor tissue (met-ARBS). Each horizontal line represents a four kilobase (kb) locus. Shade of red reflects binding intensity. (b) AR ChIP-seq binding intensity across clinical tissue subtypes in T-ARBS and met-ARBS. (c) Average DNA methylation signal at T-ARBS across prostate tumor (red curve) and normal prostate (blue curve) at T-ARBS (top) and met-ARBS (bottom).