. 2023 Feb 1;21(1):e132071. doi: 10.5812/ijpr-132071

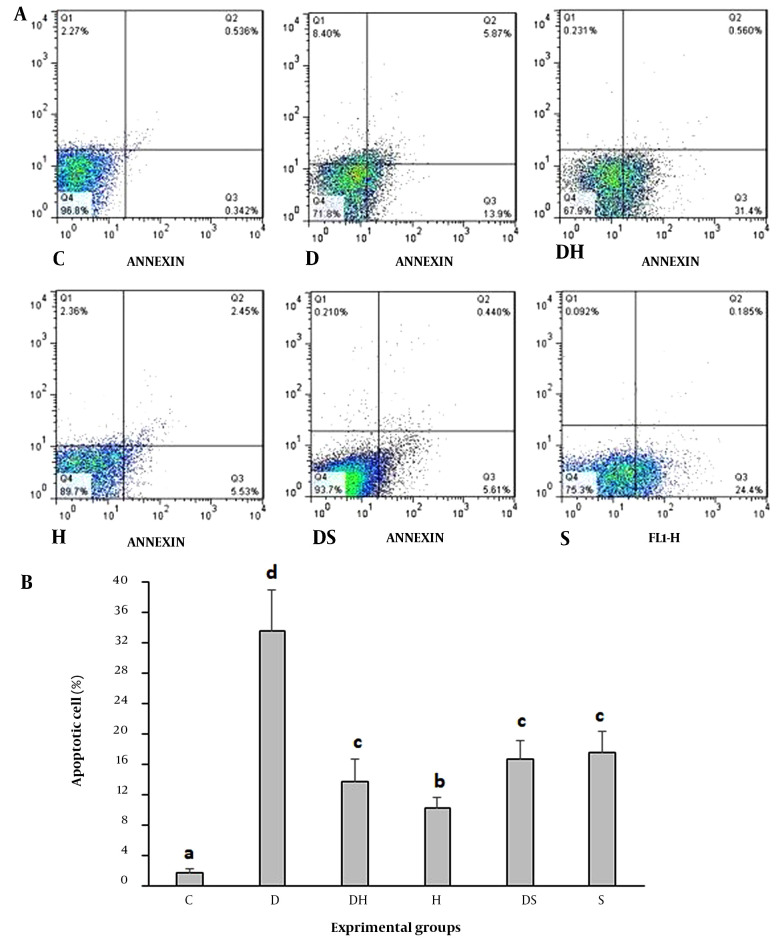
Figure 1. Flow cytometry examination of annexin V, propidium iodide (PI) staining of hippocampal tissue (A); and apoptosis rate in the experimental groups (B). The necrotic cells, FITC-annexin V-negative, PI-positive, are illustrated in the upper left quadrants of each panel. The viable cells, FITC-Annexin V-negative, PI-negative, are shown in the lower left quadrants of each panel. The upper right quadrants consist of the late apoptotic cells, positive for FITC-Annexin V binding, PI uptake. The lower right quadrants show the early apoptotic cells, FITCAnnexin V-positive, PI-negative. a, b, c, d, values with various superscripts within a column vary significantly. Abbreviations: C, control rats; D, diabetes rats; S, seed extract-treated rats; DH, harmine-treated diabetic rats; H, harmine-treated rats; DS, seed extract-treated diabetic rats.

Figure 1.