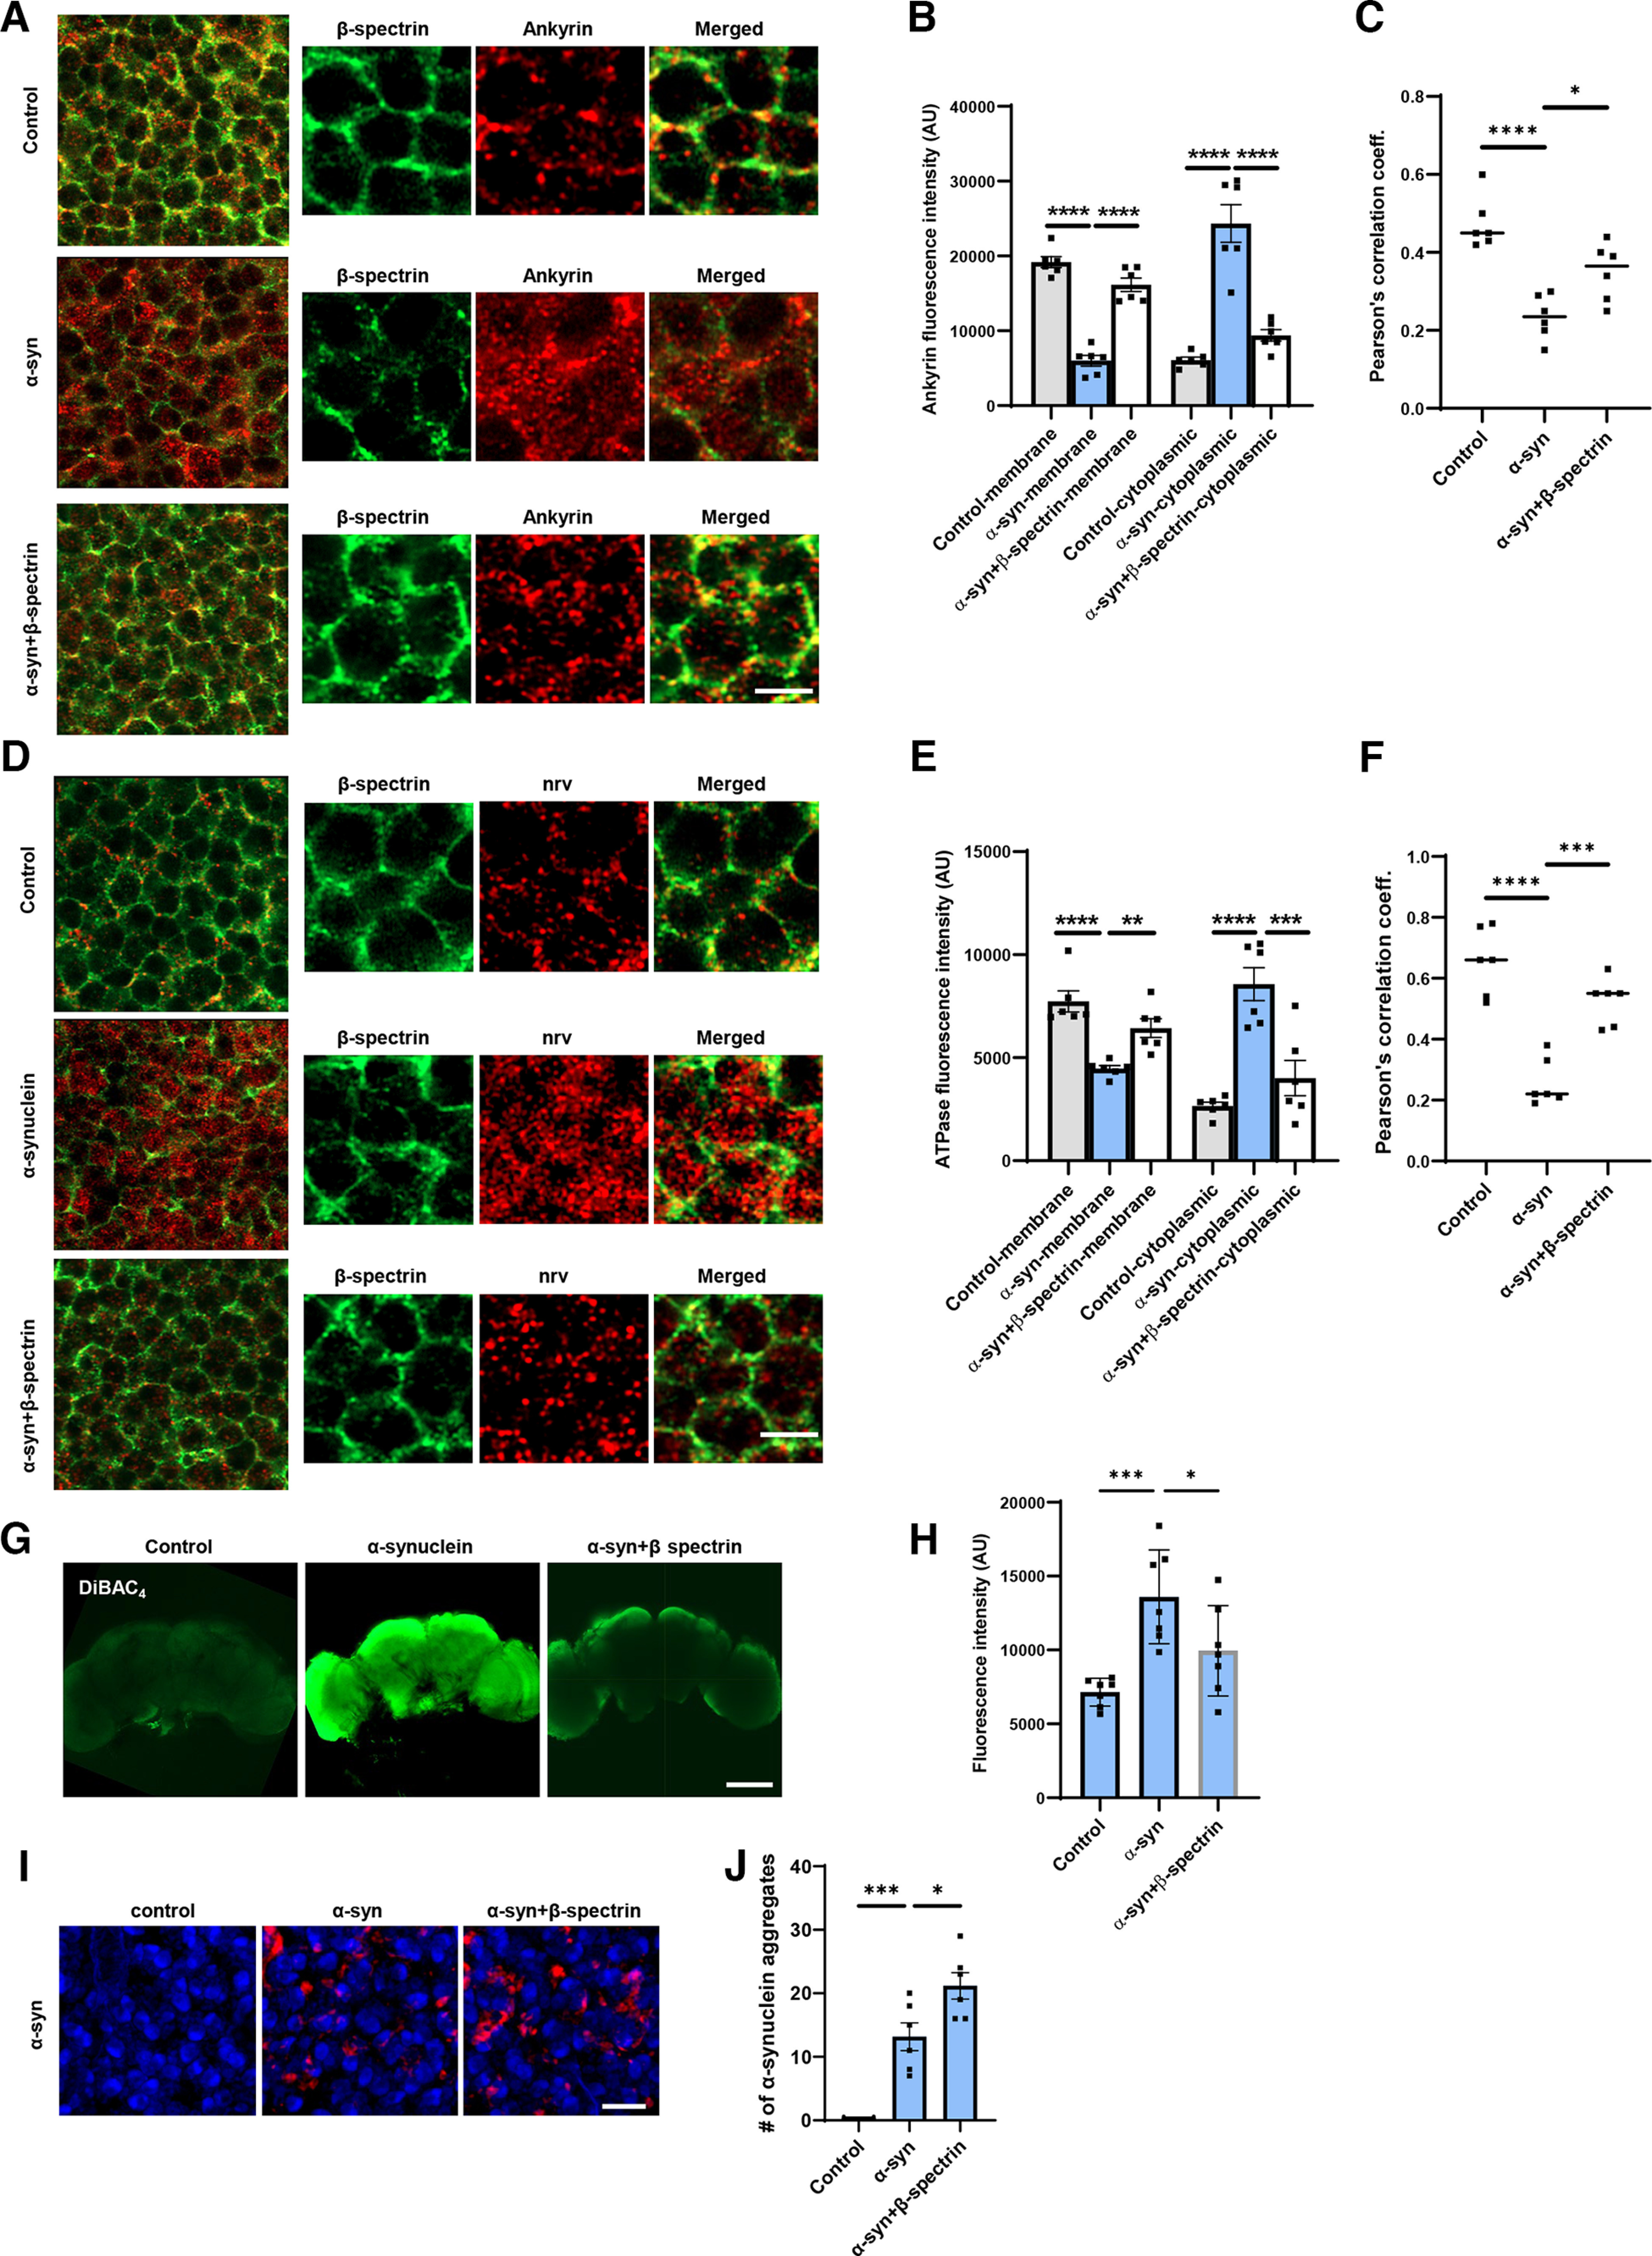
Figure 5.

Expression of α-synuclein leads to mislocalization of ankyrin and Na+/K+ ATPase in Drosophila neurons. A, B, STED microscopy reveals colocalization of ankyrin (red) with subplasmalemmal β-spectrin (green) in WT animals and increased cytoplasmic ankyrin (arrows) with expression of human α-synuclein. Elevated expression of β-spectrin partially normalizes ankyrin localization. n = 6. C, Pearson’s correlation coefficient reveals an infrequent association between β-spectrin and ankyrin in α-synuclein transgenic Drosophila. Association is partially restored with elevated expression of β-spectrin. D, E, STED microscopy reveals substantial colocalization of Na+/K+ ATPase (red) with β-spectrin (green) in WT animals and increased cytoplasmic Na+/K+ ATPase (arrows) with expression of human α-synuclein. Elevated expression of β-spectrin partially normalizes Na+/K+ ATPase localization. n = 6. F, Pearson’s correlation coefficient reveals an infrequent association between β-spectrin and Na+/K+ ATPase in α-synuclein transgenic Drosophila. Association is partially restored with elevated expression of β-spectrin. G, H, Loss of plasma membrane polarization as monitored by DiBAC4(3) following expression of human α-synuclein. Elevated expression of β-spectrin partially normalizes membrane polarization. n = 6. I, J, Immunofluorescence microscopy (I) and quantification (J) showing increased numbers of α-synuclein aggregates in neurons from fly brain sections of α-synuclein transgenic Drosophila with elevated β-spectrin. n = 6. All flies are 10 d old. Controls are nSyb, nSyb-GAL4/+. Scale bars: A, C, 2 µm; I, 5 µm; E, 50 µm. Data are mean ± SEM. p values determined with one-way ANOVA with Bonferroni post hoc test.
