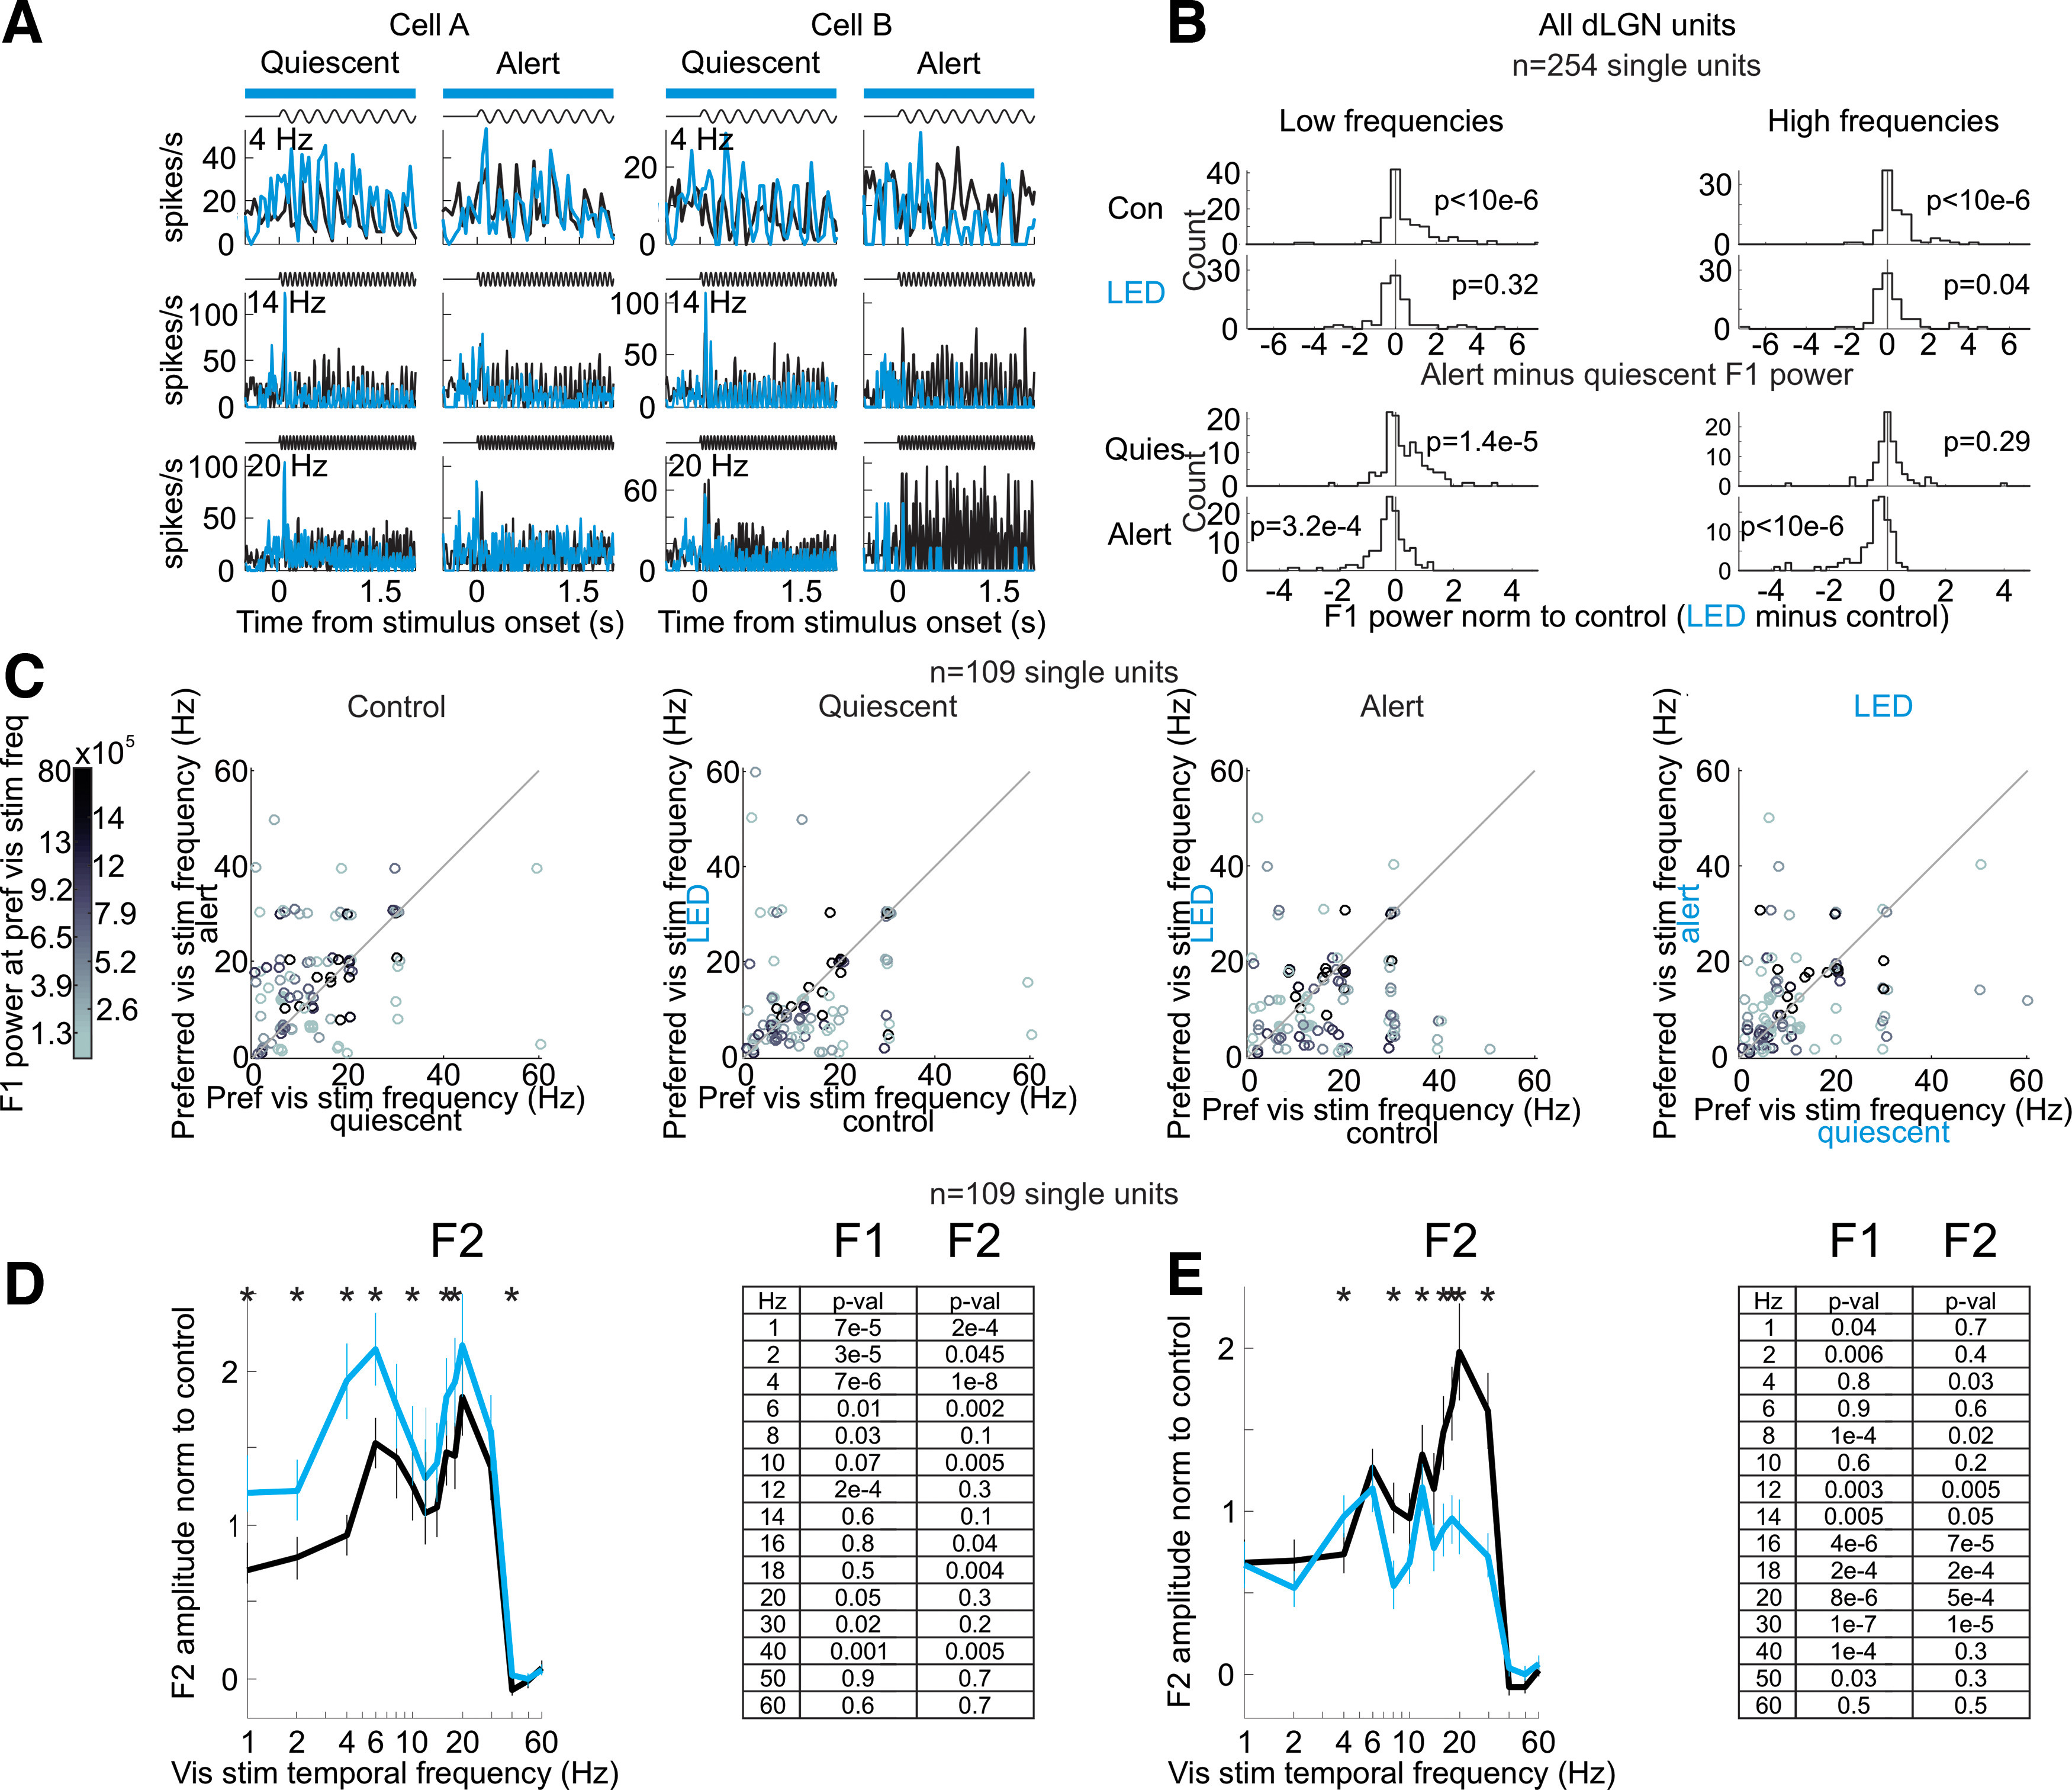
Figure 2.

Silencing visual cortex and the effects on the dLGN frequency response across various temporal frequencies of the visual stimulus. A, Example single units. Trial-averaged visual responses (peri-stimulus time histogram, PSTH) of two example single units in dLGN. Setup as in Figure 1. Black: control; blue: cortical silencing. Note that at low stimulus frequencies (4 Hz) cortical silencing increases the amplitude of the F1 response in the quiescent state, while at high stimulus frequencies (20 Hz) cortical silencing decreases the amplitude of the F1 response in the alert state. B, Summary of brain state-dependent and cortical feedback-dependent shifts across all dLGN units. Top rows, Distribution of alert minus quiescent F1 power for low (3–12 Hz; left) and high (13–40 Hz; right) stimulus frequencies in control (top) and cortical silencing (bottom). Distributions skewed toward positive values indicate that the alert F1 response was greater than the quiescent F1 response (n = 254 from 5 mice). p-values are from Wilcoxon signed-rank test. Note that with cortical silencing the distributions are centered around 0. Bottom rows, Distribution of cortical silencing minus control F1 power (normalized to control) for low (left) and high (right) stimulus frequencies in quiescent (top) and alert (bottom) conditions. Distribution skewed toward positive values indicates that the F1 response was larger during cortical silencing. Note the positively skewed distribution at low frequencies in the quiescent state and the negatively skewed distribution at high frequencies in the alert state. C, The population-level effects of cortical silencing in B may result from either (option A) an increase in the amplitude of visually responsive units preferring low temporal frequencies in the quiescent state and a decrease in the amplitude of visually responsive units preferring high temporal frequencies in the alert state, or (option B) shifts in the temporal frequency tuning of individual units. To distinguish between these possibilities, we plot the preferred visual stimulus temporal frequency of each individual single unit for units where we recorded sufficient data across all visual stimuli and brain states. We see shifts in the preferred temporal frequencies of individual single units (option B). C shows the change in preferred frequency of dLGN units as a function of brain state and cortical silencing. Color of dot is the power of that unit’s F1 response at the preferred visual stimulus frequency, referring to the quiescent control F1 response (color scale to the left). Panel labeled “Control,” Preferred visual stimulus temporal frequency in quiescent versus alert (each dot is one unit). Panel labeled “Quiescent,” Preferred visual stimulus temporal frequency in quiescent state in control versus cortical silencing. Panel labeled “Alert,” Preferred visual stimulus temporal frequency in alert state in control versus cortical silencing. Panel labeled “LED,” Preferred visual stimulus temporal frequency during cortical silencing in quiescent versus alert (n = 92 units from 3 mice). D, Some units in dLGN respond to both increases and decreases in luminance and would therefore be expected to respond at double the temporal frequency of the visual stimulus (F2 response). To test whether the brain state-specific effects of cortical silencing are similar for F2 responses, here we consider the F2 responses of dLGN units. Average and SEM of amplitude of dLGN single-unit F2 response to full-field flicker stimuli in the quiescent state. Each unit’s response is normalized by the integral of that unit’s total response (Materials and Methods). Black: control; blue: during cortical silencing. Asterisks indicate significant change with cortical silencing (p-values in table at right, paired Wilcoxon sign-rank test comparing control versus LED, asterisks indicate p < 0.05). E, As in D but for alert state.
