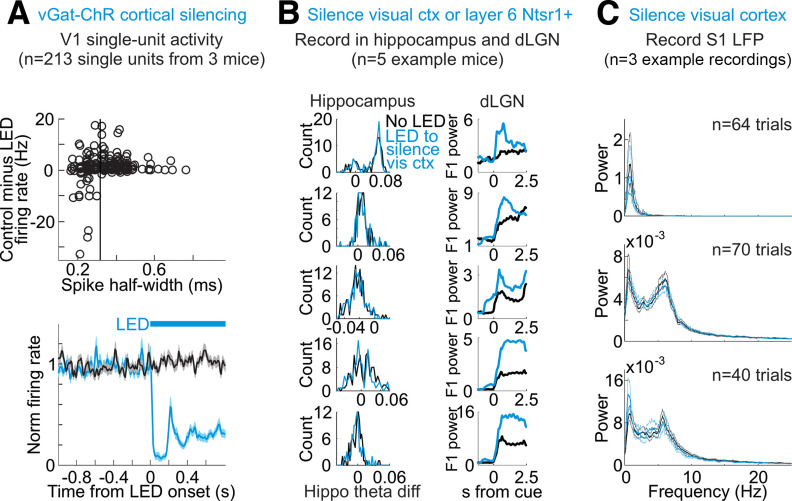
Figure 3.
Silencing of visual cortex is efficient and does not alter brain state. A, Top, Impact of LED illumination on spontaneous activity of V1 units in vGat-ChR2 mice depending on spike shape (across all layers). y-axis is spontaneous firing rate in control minus firing rate during LED illumination of cortex. Negative values indicate increase in firing rate by LED. x-axis is half-width at half-max of average spike waveform for each unit. Black vertical line indicates threshold for classifying units as regular-spiking or fast spiking (regular-spiking if spike half-width above threshold, n = 213 units from 3 mice). Bottom, Time course of the impact of LED illumination on the spontaneous activity of regular spiking units in V1 of vGat-ChR2 mice. Average and SEM from 213 units from three mice. Black trace is control; blue is with LED illumination. Blue bar indicates duration of LED illumination. All single unit firing rates normalized to 1-s baseline preceding LED onset. B, Each row is a different mouse. Left column, Histogram of hippocampus theta difference (theta diff: power at 5–7 Hz minus power at 2–4 Hz) across 14.5-s-long intervals from multiple example mice, with or without LED illumination of V1 to silence cortex. Right column, (y-axis) raw F1 power in units of 10e5 averaged across all dLGN single units with (blue) or without (black) LED illumination of V1 to silence cortex as a function of (x-axis) time from visual stimulus onset. Note clear dLGN F1 increase without change in hippocampus theta difference. C, No change in local field potential (LFP) in somatosensory cortex (S1) during silencing of visual cortex. Average and 95% confidence intervals of power spectrum of S1 LFP of three recordings from two mice. Black is control. Blue is on interleaved trials during silencing of visual cortex including quiescent and alert trials.

