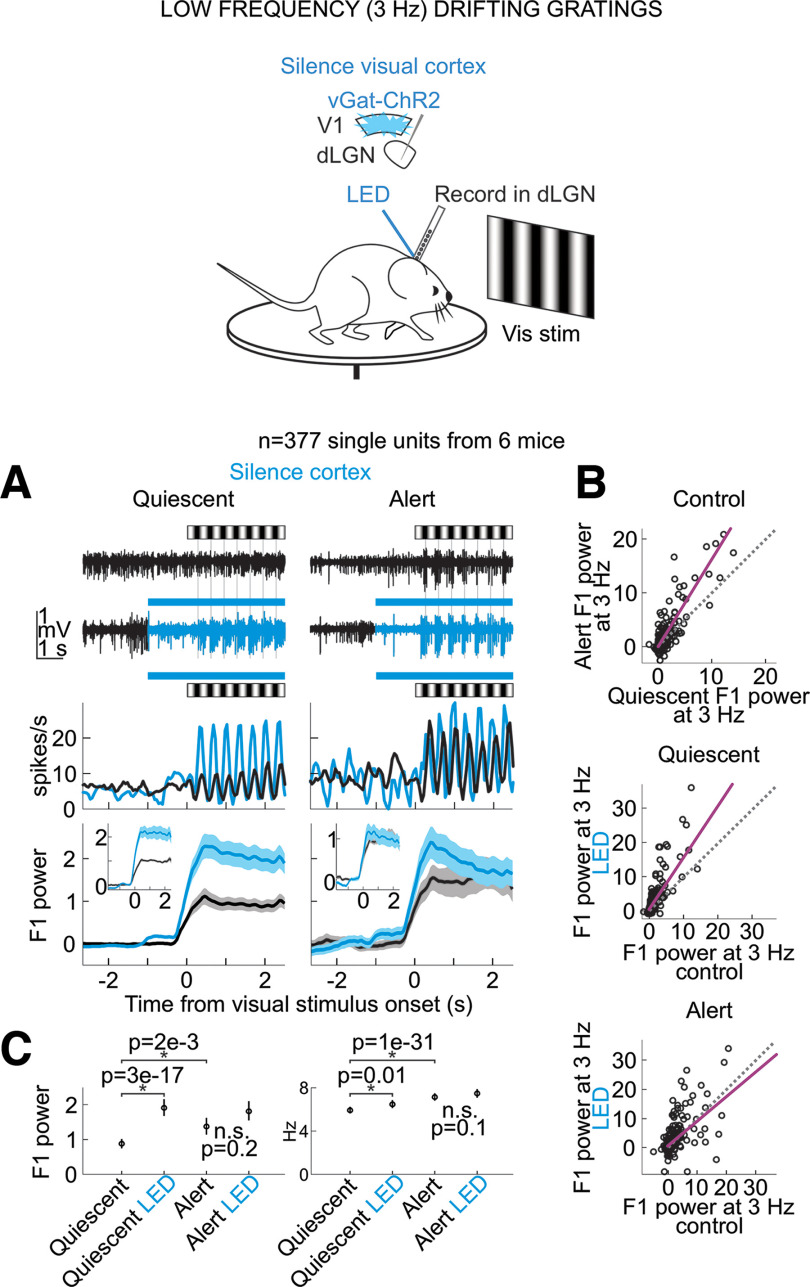
Figure 5.
Silencing the visual cortex profoundly reduces the brain state-specific differences in the visually evoked F1 response of dLGN neurons to drifting gratings. Schematic shows awake head-fixed mouse free to run or rest on a circular treadmill during electrophysiology recording and presentation of drifting gratings while silencing visual cortex by LED illumination of ChR2-expressing inhibitory cortical interneurons (vGat-ChR2). A, Top, Example dLGN multiunit (MU) traces before and during presentation of drifting gratings (0.03 cycles per degree at 3 Hz). Black: control; blue: during cortex silencing. Middle, PSTH of example dLGN single unit. Bottom, Mean and SEM of baseline-subtracted F1 power including all units (n = 377 units from 6 mice, baseline is 4 s preceding visual stimulus). F1 power in units of 1e5 throughout this figure. Insets, Mean and SEM normalized to control F1 response including only visually responsive single units (see Materials and Methods for selection of visually responsive units). B, Baseline-subtracted F1 power of responses to drifting gratings. Each dot is a single dLGN unit. Purple line is linear fit to scatter. Dotted line is unity line. Top, Quiescent control versus alert control. Middle, Quiescent control versus quiescent with cortical silencing. Bottom, Alert control versus alert with cortical silencing. C, Average and SEM across dLGN single units. Left, Baseline-subtracted F1 power. Right, Raw firing rates during visual stimulation (F0 response). p-values from paired Wilcoxon sign-rank (n = 377 units).

