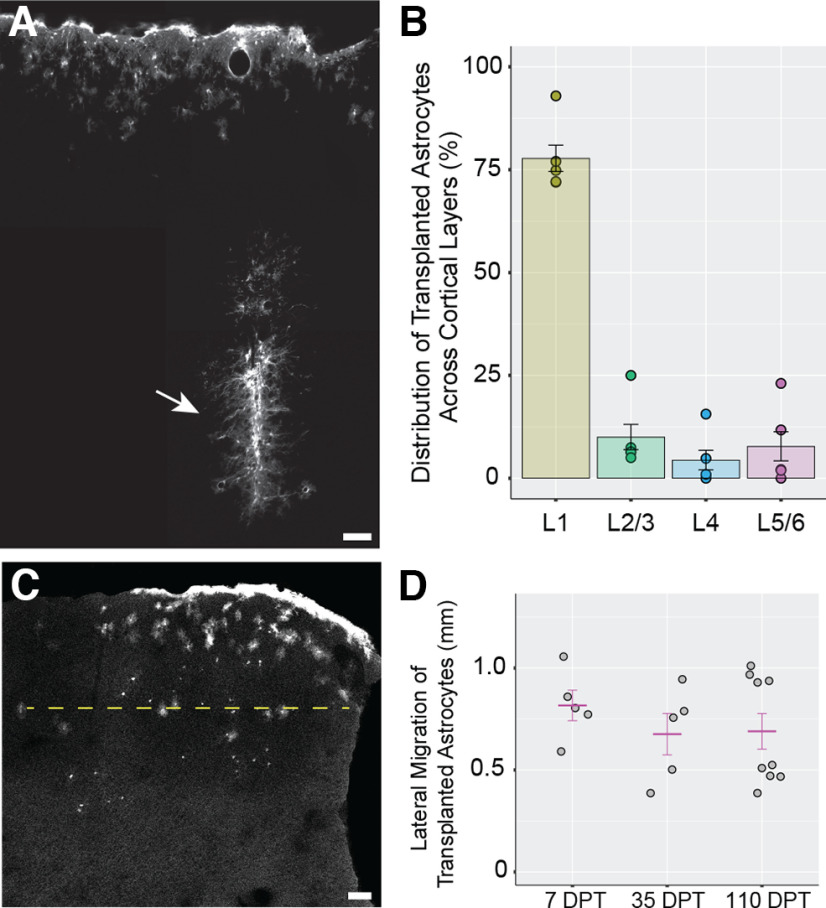
Figure 2.
Distribution of transplanted Tomato+ astrocytes in cortex. A, Image montage representing the injection track (arrow) in a transplanted cortex at 35–47 DPT. B, Distribution of transplanted astrocytes across cortical layers at 35–47 DPT. Circles represent mean astrocyte number values per mouse for each layer region. L1 = layer 1, L2/3 = layers 2 and 3, L4 = layer 4, L5/6 = layers 5 and 6. C, The lateral migration distance (LMD; yellow dashed line) was defined as the maximum distance between transplanted astrocytes measured along the medio-lateral axis in sections without an injection track. In sections with injection track, the lateral migration distance was measured on the direction perpendicular to the injection track (data not shown). D, Lateral migration distance of transplanted astrocytes at different times post-transplantation. 35 DPT = 35–47 DPT, 110 DPT = 110–130 DPT. Gray circles represent mean LMD values per mouse. The mean LMD for each experimental group (magenta lines) are 0.816 ± 0.075 mm at 7 DPT, 0.676 ± 0.101 mm at 35–47 DPT, and 0.689 ± 0.087 mm at 110–130 DPT. No significant differences were detected between LMD values across post-transplantation times (p = 0.562, one-way ANOVA). Scale bar: 50 µm (A) and 100 µm (C). Data are mean ± SEM.

