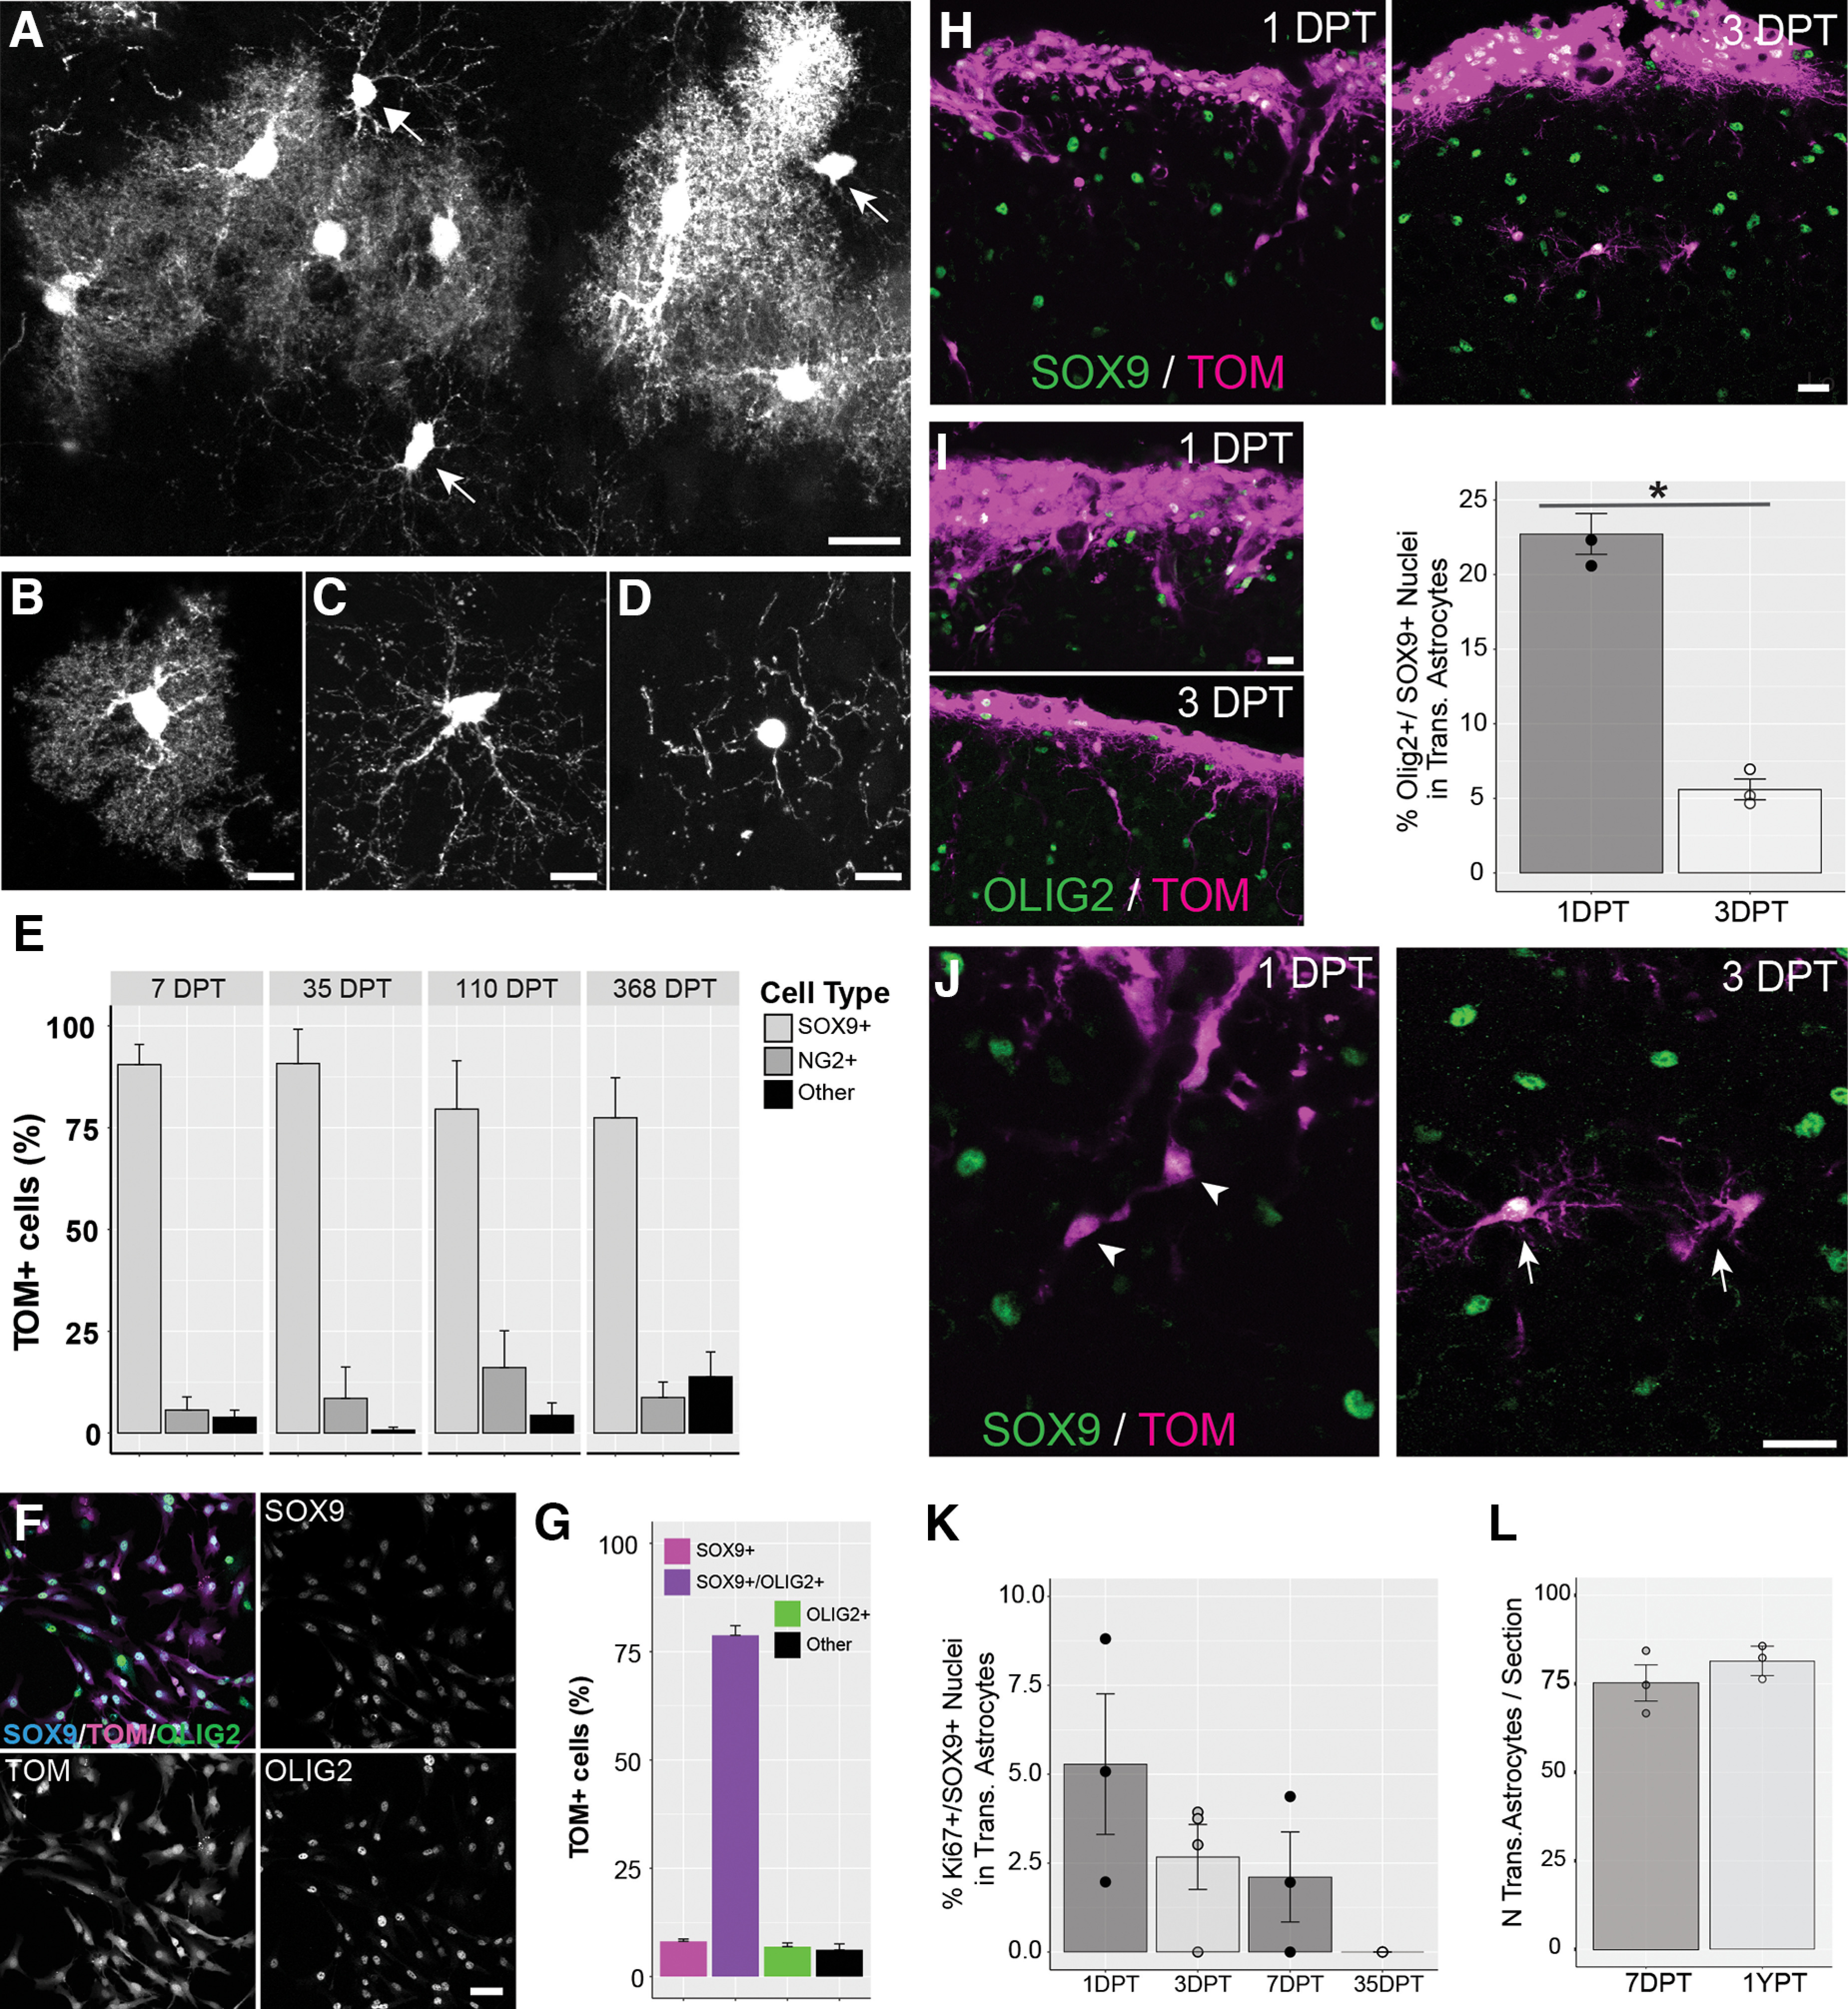
Figure 3.

Characterization of transplanted cells. A–D, While most transplanted Tomato+ cells display a protoplasmic astrocytic morphology (B), some display less ramified, longer processes typical of oligodendrocyte precursor cells (C, OPCs; see also arrows in A) or immature oligodendrocytes (D). E, Cell-specific markers were used to identify the percentage of transplanted cells as Sox9+ astrocytes (B), NG2+ OPCs (C), or cells not expressing either Sox9 or NG2 referred to as “other” cells (D). F, Cultured cells expressing Sox9 and the glial precursor marker Olig2. Tom = Tomato. G, Percentage of TOM+ cultured cells positive for Sox9 only, Sox9 and Olig2, or Olig2 only. Cells not expressing either Sox9 or Olig2 were referred as “other” cells. H, Sox9 expression in transplanted cells at 1 DPT and 3 DPT. I, Left panels, Olig2 expression in transplanted cells at 1 DPT and 3 DPT. Right panel, Percentage of Olig2+ cells among transplanted astrocytes at 1 DPT and 3 DPT. Circles and bars represent mean values per mouse and mean values per group, respectively. The percentage of Olig2+/Sox9+ cells among transplanted astrocytes was significantly lower at 3 DPT compared with 1 DPT (1 DPT, 22.73 ± 1.37; 3 DPT 5.6 ± 0.7; *p = 0.0004 Student’s t test). J, Most transplanted astrocytes have a simple, fusiform shape at 1 DPT (arrowhead), and take on a ramified stellate morphology at 3 DPT (arrow). K, Quantification of cell proliferation (Ki67+ nuclei) among transplanted astrocytes at different times after transplantation. Circles represent mean values per mouse. The mean values per experimental group (bars) are 7.21 ± 2.38% at 1 DPT, 2.67 ± 0.91% at 3 DPT, 2.11 ± 1.26% at 7 DPT and 0 at 35–47 DPT. Significant differences were not detected between the mean values per experimental group across times post-transplantation (p = 0.09, one-way ANOVA). L, Number of transplanted astrocytes per section at 7 DPT and 368–570 DPT (1 YPT). Circles and bars represent mean values per mouse and mean values per group, respectively. Scale bar: 20 µm (A, H–J), 10 µm (B–D), and 50 µm (F). Data are mean ± SEM.
