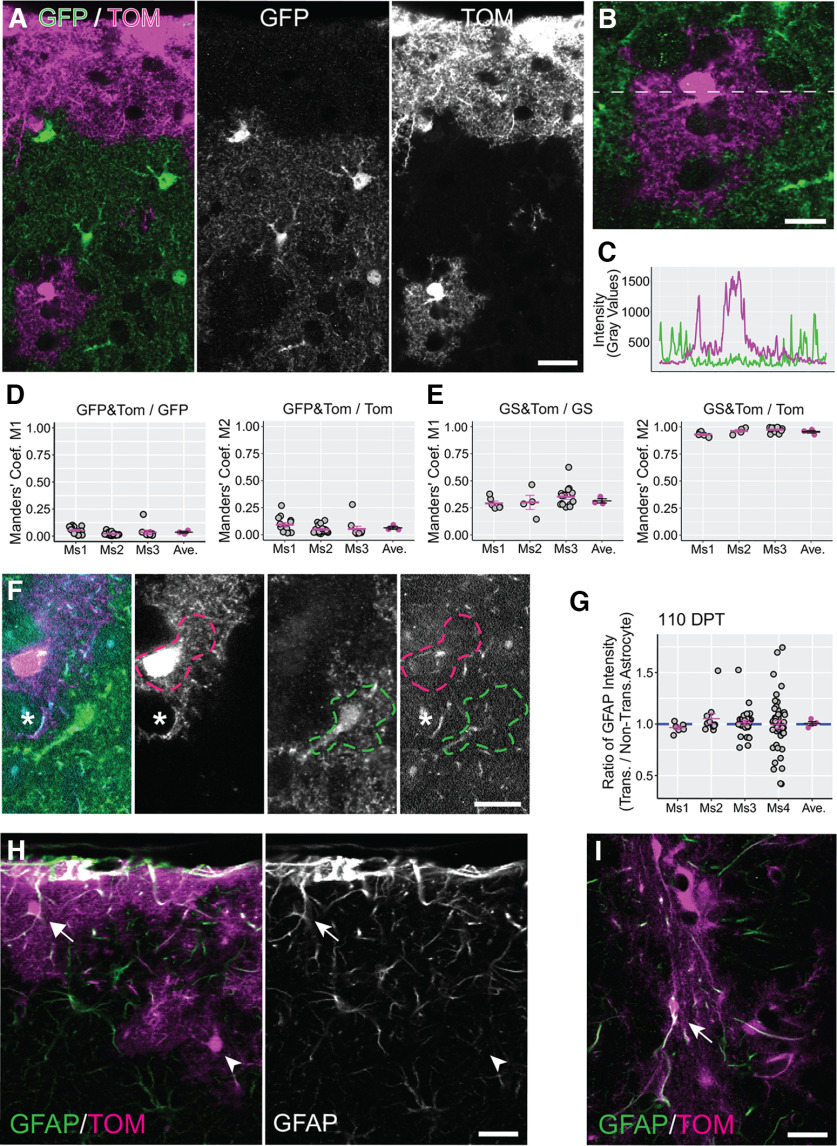
Figure 4.
Transplanted astrocytes develop unique morphologic territories and have normal levels of GFAP. A, In the cortex of transplanted Aldh1L1-eGFP mice, the GFP+ and Tomato+ astrocytes show complementary organization. Tom = Tomato. B, C, Intensity values for GFP and Tomato signals were measured along a line drawn across adjacent transplanted and resident astrocytes. GFP and Tomato intensity profiles showed little overlap between the two signals (C). D, E, Manders’ coefficients representing colocalization between GFP and Tomato (D) and colocalization between glutamine synthetase (GS) and Tomato (E) calculated for three mice (Ms1–Ms3) at 35–47 DPT. Gray circles are Manders’ coefficient values calculated for single image fields, whereas lines represent mean coefficient values computed for each transplanted mouse (magenta) and across all mice in the same experimental group (black). In D, M1 and M2 represent the fraction of GFP signal colocalized with Tomato (GFP&TOM/GFP) and the fraction of Tomato signal colocalized with GFP (GFP&TOM/TOM), respectively. In E, M1 and M2 represent the fraction of glutamine synthetase (GS) signal colocalized with Tomato (GS&TOM/GS) and the fraction of Tomato signal colocalized with GS (GS&TOM/TOM), respectively. F, GFAP expression levels were compared between transplanted (magenta dashed line) and nontransplanted astrocytes (green dashed line) by measuring GFAP intensity in territories occupied by the two kinds of astrocytes. Astrocytic processes that were potentially identified as endfeet (asterisk) were excluded from the quantification. G, Transplanted/nontransplanted ratio values for GFAP expression calculated for single image fields (gray circles) in four mice (Ms1–Ms4) at 110–130 DPT. Magenta lines/circles represent mean values per mouse. The mean value across all mice (black line) was not significantly different from 1 (1.007 ± 0.018; p = 1, Wilcoxon rank-sum test). H, GFAP immunolabeling at 35–47 DPT in the superficial layer of the cortex (mouse transplanted at P3–P7). Similar to nontransplanted astrocytes, transplanted astrocytes displayed high GFAP levels close to the pial membrane (arrow) and lower GFAP levels deeper in cortex (arrowhead). I, GFAP immunolabeling at 35–47 DPT at the injection site (mouse transplanted at P3–P7). Transplanted astrocytes express high levels of GFAP at the injection site (arrow). Scale bar: 20 µm (A, H, I) and 10 µm (B, F). Data are mean ± SEM.

