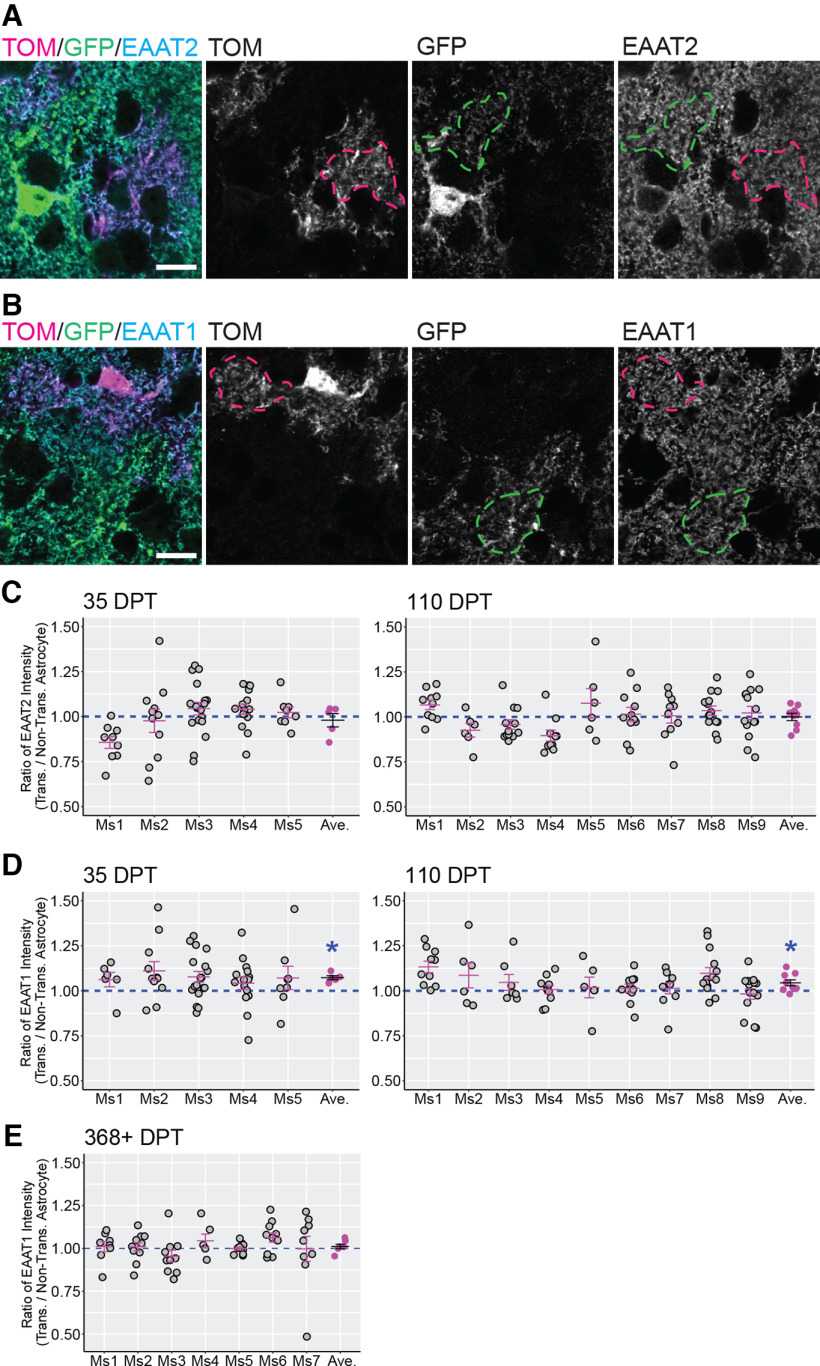
Figure 5.
Expression of glutamate transporters EAAT2/GLT1 and EAAT1/GLAST in transplanted and nontransplanted astrocytes. A, B, Representative ROIs used to measure EAAT2/GLT1 (A) and EAAT1/GLAST (B) intensity in territories occupied by transplanted (magenta dashed line) and nontransplanted (green dashed line) astrocytes. Tom = Tomato. C–E, Transplanted/nontransplanted ratio values for GLT1 and GLAST at different times after transplantation. Ratio values for both glutamate transporters were calculated at 35–47 DPT and at 110–130 DPT (C, D), and an additional time point for GLAST was added at 368–570 (368+) DPT (E). Gray circles and magenta lines/circles represent ratio values per image field, and mean ratio values per mouse (Ms), respectively. The mean ratio values for each experimental group (black lines) are 0.979 ± 0.037 for GLT1 at 35–47 DPT (p = 0.656, Wilcoxon rank-sum test), 1 ± 0.020 for GLT1 at 110–130 DPT (p = 0.22, Wilcoxon rank-sum test), 1.073 ± 0.011 for GLAST at 35–47 DPT (*p = 0.007, Wilcoxon rank-sum test), 1.044 ± 0.017 for GLAST at 110–130 DPT (*p = 0.003, Wilcoxon rank-sum test), and 1.011 ± 0.013 for GLAST at 368–570 DPT (p = 0.68, Wilcoxon rank-sum test). Scale bar: 10 µm (A, B). Data are mean ± SEM.

