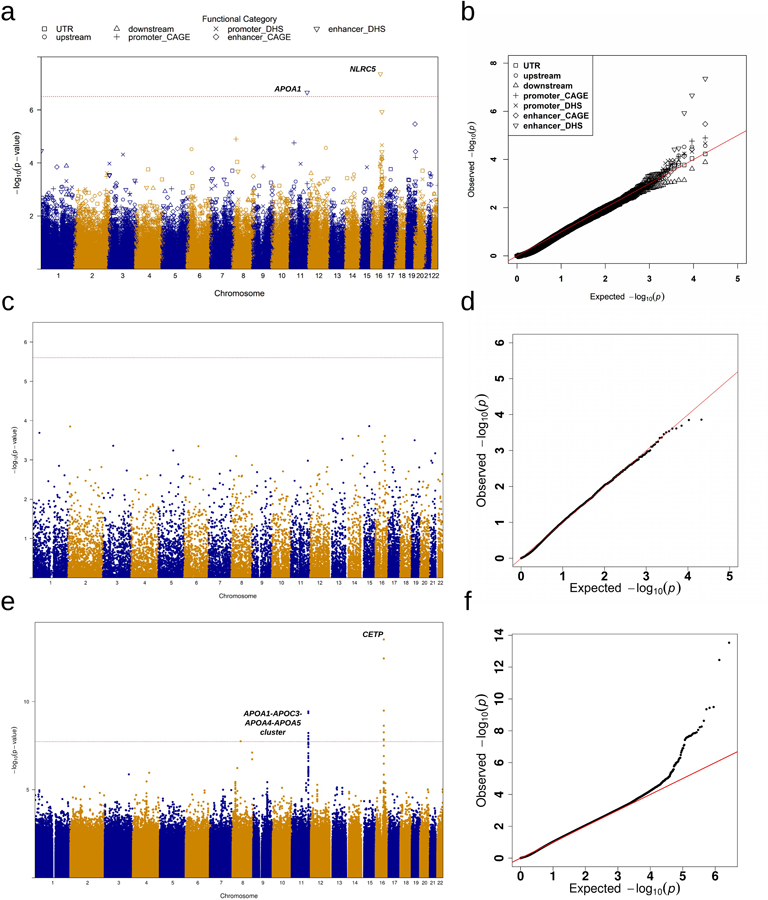
Extended Data Fig. 2|. Manhattan plots and Q-Q plots for unconditional gene-centric noncoding analysis and sliding window analysis of high-density lipoprotein cholesterol (HDL-C) in the discovery phase (n=21,015).

a, Manhattan plots for unconditional gene-centric noncoding analysis of protein-coding gene. The horizontal line indicates a genome-wide STAAR-O P value threshold of . The significant threshold is defined by multiple comparisons using the Bonferroni correction . Different symbols represent the STAAR-O P value of the protein-coding gene using different functional categories (upstream, downstream, UTR, promoter_CAGE, promoter_DHS, enhancer_CAGE, enhancer_DHS). Promoter_CAGE and promoter_DHS are the promoters with overlap of Cap Analysis of Gene Expression (CAGE) sites and DNase hypersensitivity (DHS) sites for a given gene, respectively. Enhancer_CAGE and enhancer_DHS are the enhancers in GeneHancer predicted regions with the overlap of CAGE sites and DHS sites for a given gene, respectively. b, Quantile-quantile plots for unconditional gene-centric noncoding analysis of protein-coding gene. Different symbols represent the STAAR-O P-value of the gene using different functional categories (upstream, downstream, UTR, promoter_CAGE, promoter_DHS, enhancer_CAGE, enhancer_DHS). c, Manhattan plots for unconditional gene-centric noncoding analysis of ncRNA gene. The horizontal line indicates a genome-wide STAAR-O P value threshold of . The significant threshold is defined by multiple comparisons using the Bonferroni correction . d, Quantile-quantile plots for unconditional gene-centric noncoding analysis of ncRNA gene. e, Manhattan plot for 2-kb sliding windows. The horizontal line indicates a genome-wide P value threshold of . The significant threshold is defined by multiple comparisons using the Bonferroni correction . f, Quantile-quantile plot for 2-kb sliding windows. In panels, a, c and e, the chromosome number are indicated by the colors of dots. In all panels, STAAR-O is a two-sided test.
