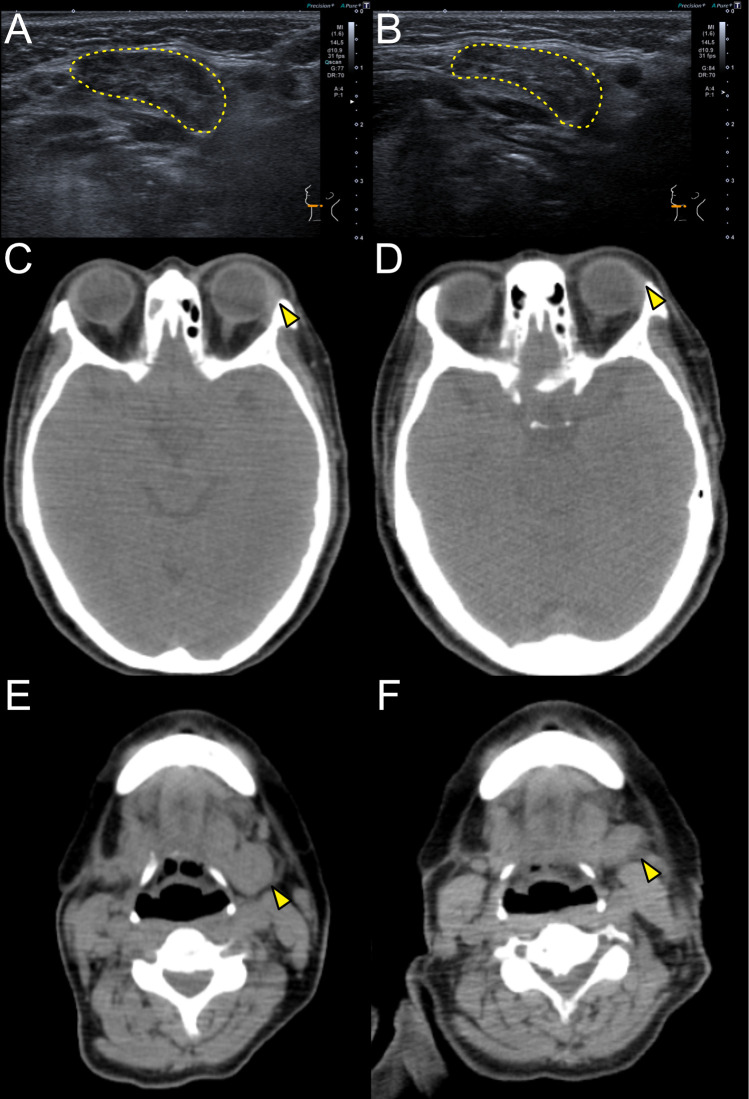
Figure 1.
Changes in CT or sonography during dupilumab administration (A, B) Images of sonography around the left submandibular glands in case 1 at the baseline (A) and 6 months after the first administration of dupilumab (B). The yellow dashed lines show left submandibular glands. (C, D) Horizontal images of CT around the lacrimal glands in case 2 at the baseline (C) and 6 months after the first administration of dupilumab (D). The yellow arrowheads show left lacrimal glands. (E, F) Horizontal images of CT around the submandibular glands in case 2 at the baseline (E) and 6 months after the first administration of dupilumab (E). The yellow arrowheads show left submandibular glands.

