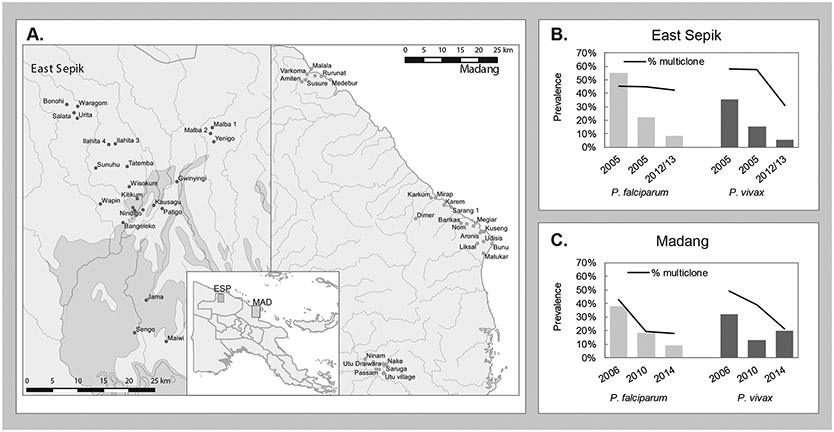
Figure 1. Map of the study areas and infection prevalence from 2005-2016.
(A) Map of East Sepik and Madang study area villages and locations on the north coast of Papua New Guinea (inset) The graphs show the pre-LLIN (2005/6) and post-LLIN (2010-2014) molecular prevalence for (B) East Sepik and (C) Madang for both P. falciparum (light grey) and P. vivax (dark grey) and proportion of multiclonal infections (black line) (Arnott et al., 2013; Barry et al., 2013; Kattenberg et al., 2020; Koepfli et al., 2017; Koepfli et al., 2015; Mueller et al., 2009; Senn et al., 2012).

