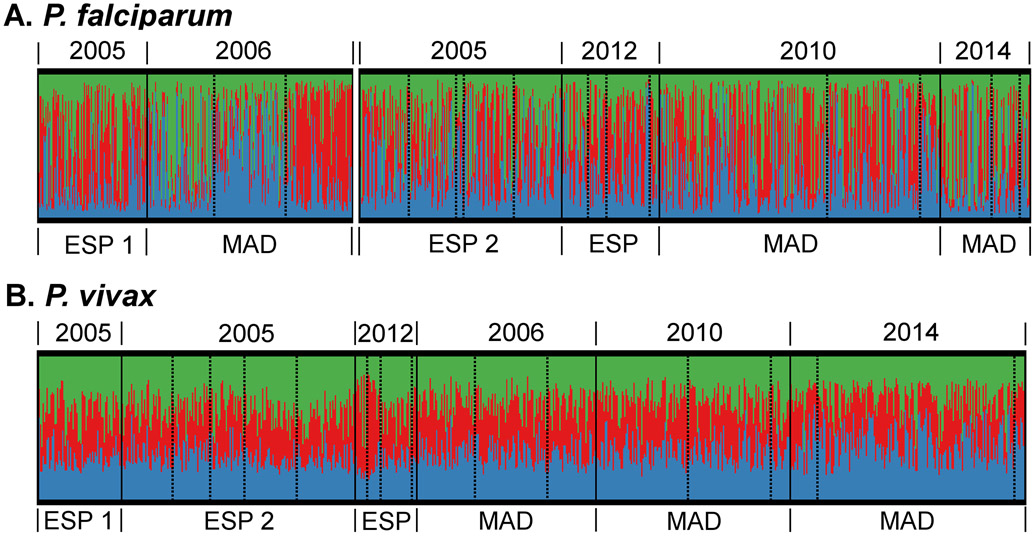
Figure 4. Bayesian cluster analysis of P. falciparum (A) and P. vivax (B) of pre- (2005/6) and post-LLIN studies (2010-2014).
Individual samples are sorted by province and year (solid lines), catchment area (dashed line) and cluster membership (colour). Madang catchments are organised as Malala, Mugil, Utu and ESP2 and 2012-13 as Brukham, Burui, Ilahita, Ulupu, and Wombisa (no infections in 2012). As identified in the genetic differentiation analysis (Jost’s D, Figure 3), there was moderate differentiation for P. falciparum between the ESP1 (Wosera area) 2005 and Madang 2006 versus the other studies (only one province included pre-LLIN), which is believed to be for a large part caused by experimental- and data analysis differences. Therefore, these P. falciparum studies were grouped separately for the population structure analysis, in order to avoid artificial changes in ancestry over time.

