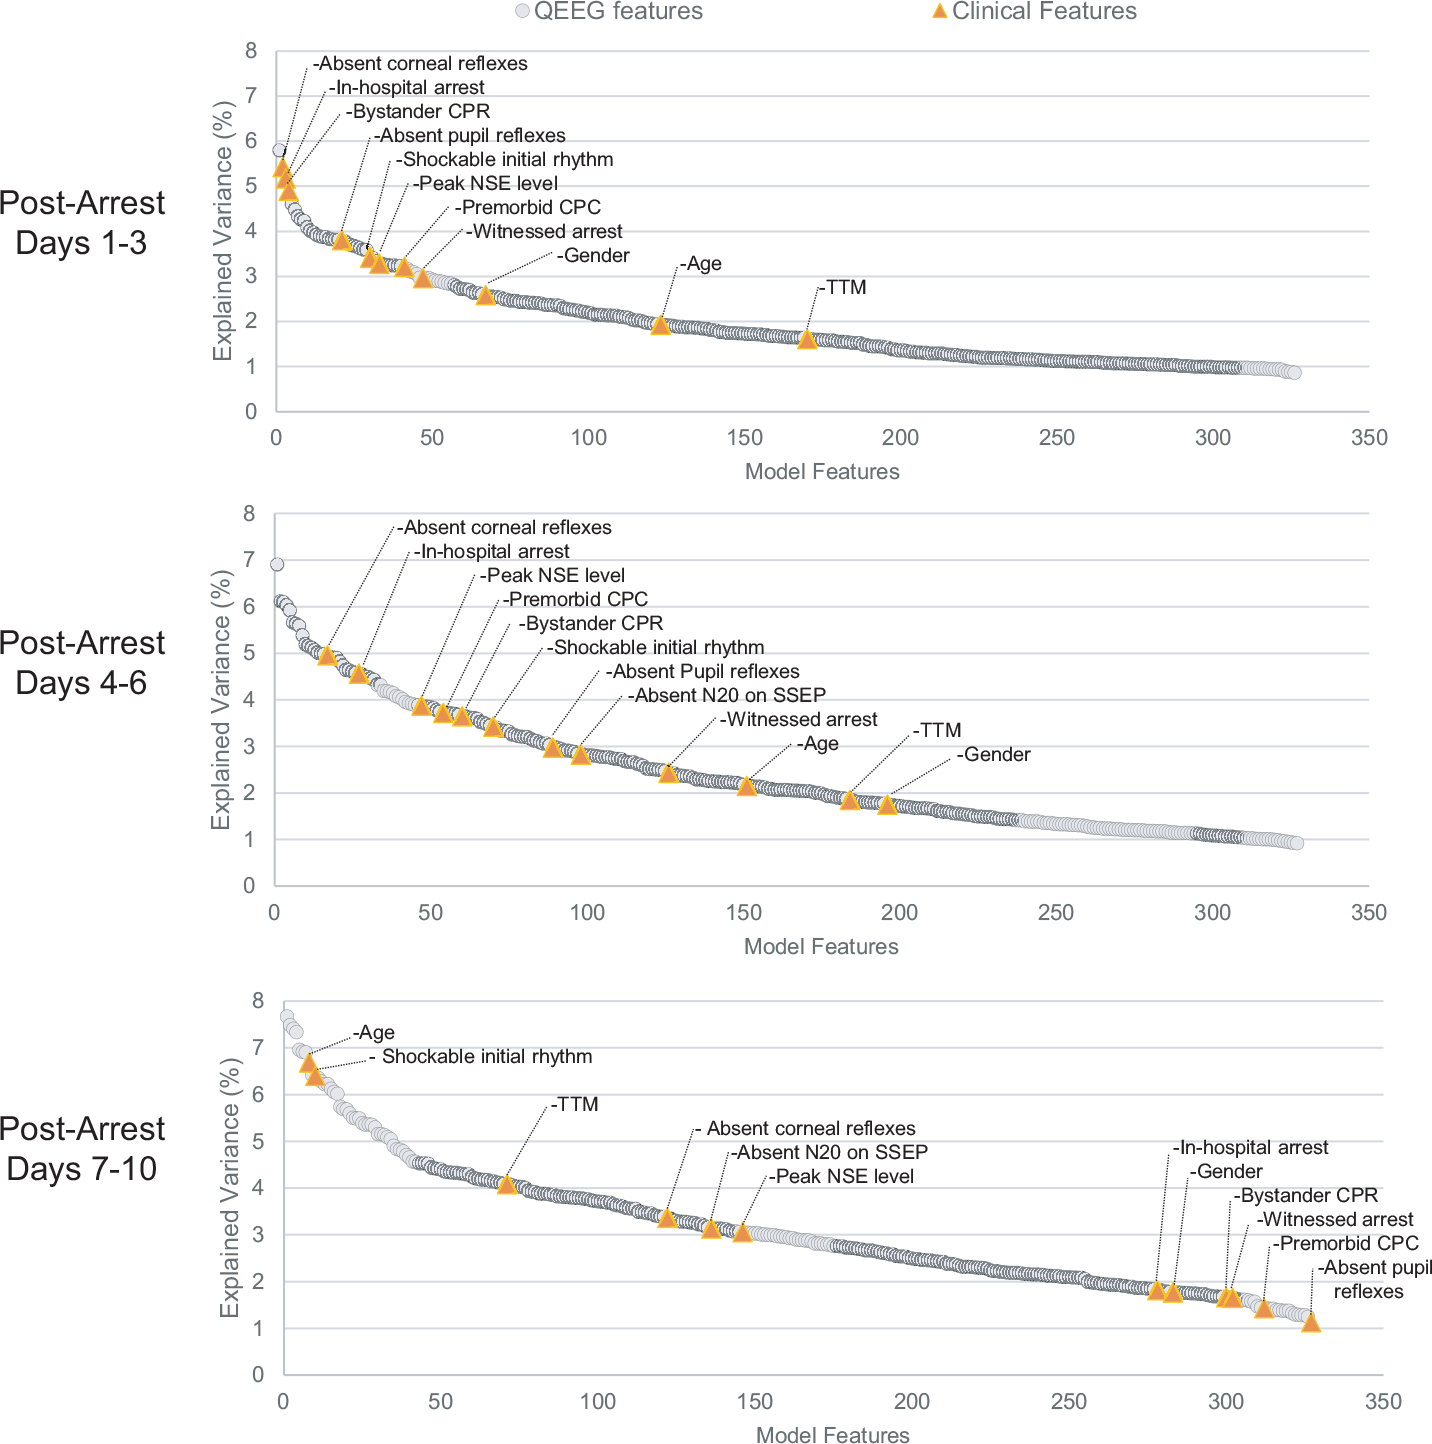
Fig. 2 –

Explained variance (R2) for each model feature, presented for each time bin and ranked in order of highest R2 value. In post-CA days 1–3, clinical features showed a higher influence compared to QEEG features. In the later time periods this trend had reversed, with QEEG features playing a much larger relative role in the prognostic model. When combined, all QEEG features explained 10.9% of the model variance, while all clinical features combined explained 29.0%, and all features combined explained 34.9% of the model variance.
