Figure 2.
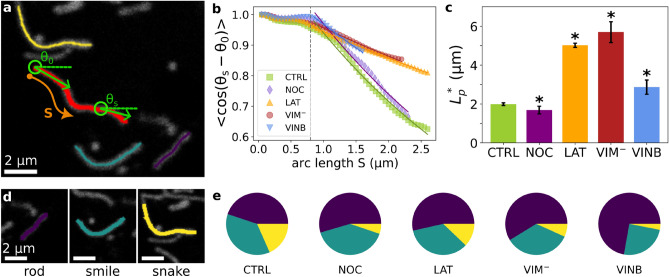
Characterization of mitochondria apparent stiffness and shape distribution. (a) Representative confocal image of mitochondria within melanocytes. Elongated mitochondria showing characteristic shapes (shown in colours) were analyzed to compute the tangent angle (, green) at a distance s (orange arrow) from their edge. (b, c) Determination of mitochondria apparent persistence length (). The ensemble average of the correlation of the tangent angle obtained for each experimental condition was fitted with Eq. (5) to determine the (b). values are shown in (c) and Supplementary Table S5. The values were considered significantly different with respect to the control condition (indicated by asterisks) if the error intervals did not overlap, as described in “Methods”. (d,e) Distribution of mitochondria shapes. Mitochondria shapes were classified as rod- (violet), smile- (light blue) and snake-like (yellow) according to their curvature (d). The proportion of these mitochondrial populations obtained for each experimental condition are illustrated in (e) and displayed in Supplementary Table S5.

