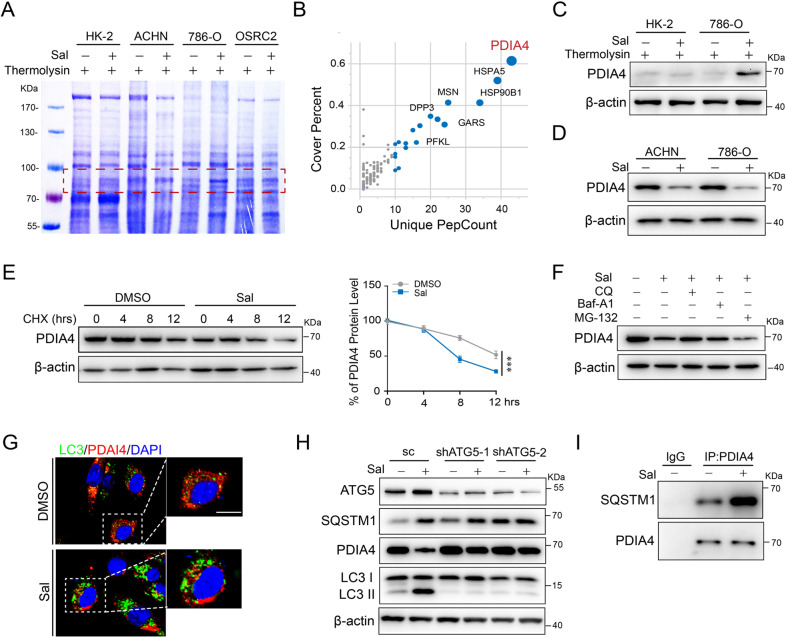
Fig. 2. Sal induces autophagic degradation of PDIA4.
HK-2 and RCC cell lines ACHN, 786-O, and OSRC2 were treated with DMSO or Sal (2 µM), and lysates were subjected to thermolysin digestion. A Coomassie blue staining. B Enrichment of proteins in the protected band (red frame in (A)) revealed by mass spectrometry analysis. C Western blot assay of cell lysates using antibodies against PDIA4. 786-O and ACHN cells were treated with DMSO or Sal (2 µM). D Western blot assay of cell lysates using antibodies against PDIA4. The volume of β-actin was used as the loading control. 786-O cells were treated with DMSO or Sal (2 µM) and subjected to protein synthesis inhibitor CHX as indicated. E Western blotting assay of cell lysates using antibodies against PDIA4 (left). The curve of protein degradation rate (right). Data are present as mean ± S.E.M., n = 5. P values were calculated using Student’s t-test. ***P < 0.001. 786-O cells were treated with DMSO or Sal (2 µM) in the presence of proteasome inhibitor MG-132 or autophagy inhibitor Baf-A1 or CQ. F Western blot assay of cell lysates using antibodies against PDIA4. 786-O cells were treated with DMSO or Sal (2 µM). G Immunofluorescence staining using antibodies against LC3 (green) and PDIA4 (red). Scale bar: 10 μm. Stable ATG5-silencing down or scramble control 786-O cells were treated with DMSO or Sal (2 µM). H Western blot assay of cell lysates using antibodies against ATG5, SQSTM1, PDIA4, or LC3. I Co-immunoprecipitation assay of cell lysates in Sal-treated 786-O cells. IP was performed using antibodies against PDIA4 and immunoblotting with antibodies against SQSTM1.

