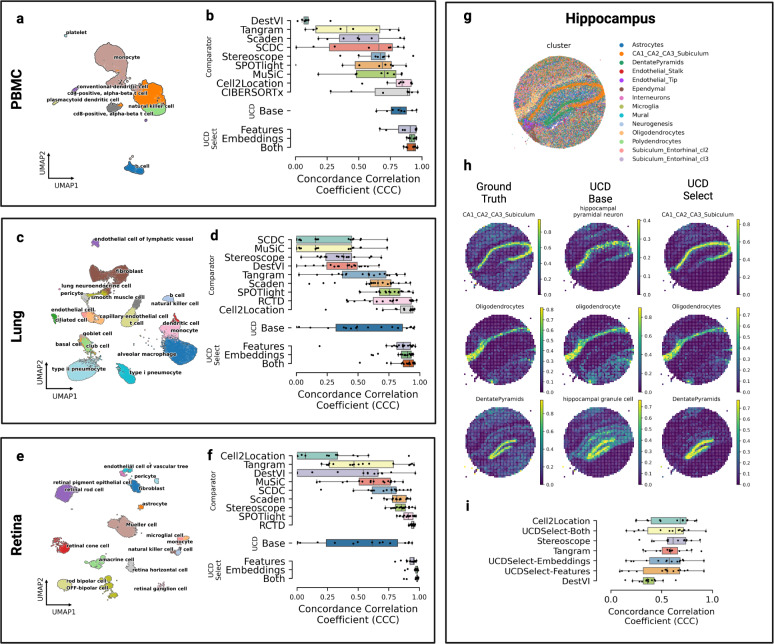
Fig. 1. Benchmarking UniCell deconvolution performance across tissue types.
a UMAP visualization of human peripheral blood mononuclear cell (PBMC) single cells used to generate pseudobulk mixtures for deconvolution benchmarking, annotated by cell type. b Box plots of deconvolution performance for each cell type (n = 8) in the PBMC dataset, stratified by method (y-axis), as measured by concordance correlation coefficient (x-axis). c UMAP visualization of human lung tissue single cells used to generate pseudobulk mixtures for deconvolution benchmarking, annotated by cell type. d Box plots of deconvolution performance for each cell type (n = 19) in the lung dataset, stratified by method (y-axis), as measured by concordance correlation coefficient (x-axis). e UMAP visualization of human retina periphery single cells used to generate pseudobulk mixtures for deconvolution benchmarking, annotated by cell type. f Box plots of deconvolution performance for each cell type (n = 17) in the retina dataset, stratified by method (y-axis), as measured by concordance correlation coefficient (x-axis). g Spatial profile of murine hippocampal formation profiled using Slide-SeqV2 colored by individual cell type. h Spatial heatmaps representing a downsampled hippocampal dataset, where each spot represents the average gene expression profile obtained from multiple individual cells in close spatial proximity. The first column illustrates the ground truth fractions of three representative cell types comprising the downsampled spatial spots (with the scale ranging from 0 to 1 representing 0% to 100% of cells in that downsampled spatial spot corresponding to a given cell type). The middle column denotes cell fraction predictions for matched or related cell types given by UCD Base. The rightmost column denotes cell type predictions made by UCD Select trained on individual cell profiles from the source dataset. i Box plots of deconvolution performance for each cell type (n = 14) in the hippocampal dataset, stratified by method (y-axis), as measured by concordance correlation coefficient (x-axis). For boxplots in b, d, f and i, the center line, box limits and box whiskers correspond to the median, first and third quartiles, and the 1.5x interquartile range, respectively. Individual data points are superimposed over each boxplot.

