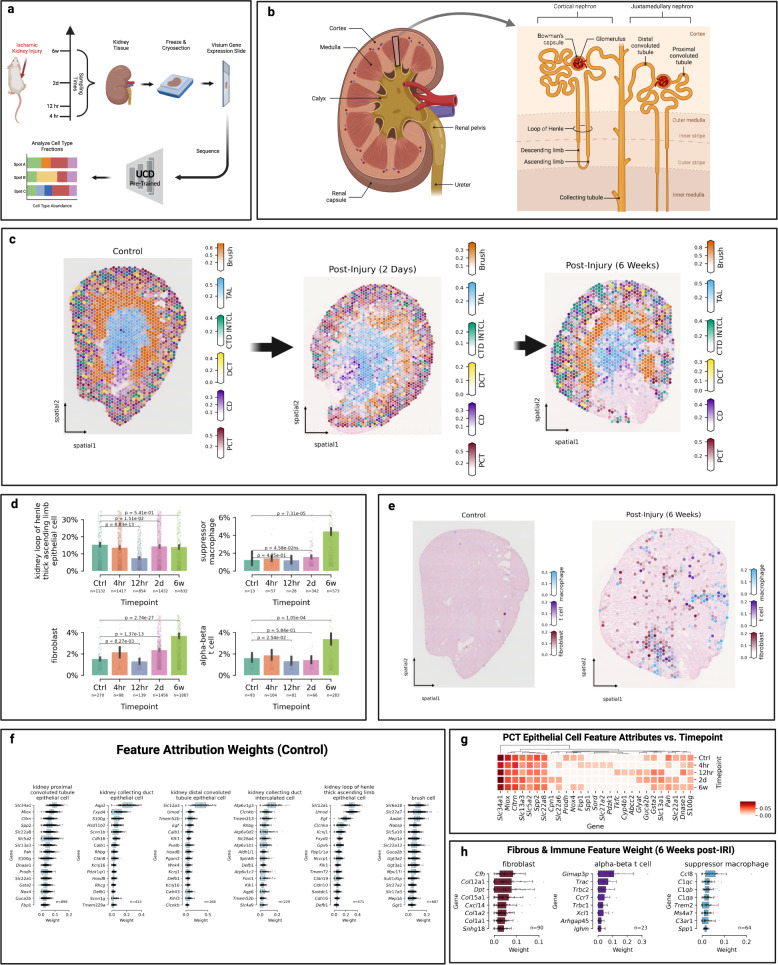
Fig. 2. UniCell deconvolves mouse kidney undergoing ischemic reperfusion injury.
a Five publically available spatial transcriptomics samples were acquired representing kidney cross sections taken from mice at different stages of ischemic renal reperfusion injury (IRI), and analyzed using UCDBase to determine predicted cell type compositions. A visual summary of the experimental conditions and sample processing is provided. b Overview of critical kidney anatomy and general spatial localization of key kidney cell types is shown as a reference. c Spatial deconvolution and distribution of select cell types of the murine kidney across different time points (n = 1 spatial sample at each time point) following IRI. d Bar plots of average predicted fractions (y-axis) for select cell types deconvolved from spatial transcriptomics samples taken at different time points (x-axis) following IRI. Sample sizes are shown beneath each compared condition, representing individual spatial capture spots. Spots with <0.5% reported fraction of a given cell type were excluded from analysis. Bar height denotes the average predicted cell type fraction for each cell type across conditions. Error bars denote 95% confidence interval (CI). P-values indicate the significance of difference between groups evaluated using an unpaired two-sided Wilcoxon rank sum test, with Benjamini-Hochberg correction for multiple comparisons (Source Data File—(d)). e Spatial predictions of fibrotic and immune infiltrate before and after IRI (n = 1 spatial sample at each time point). f Box plots of feature attribution weights (x-axis) for genes (y-axis) indicative of select cell types predicted to be present at the control (n = 1) timepoint. Sample sizes represent individual spatial capture spots with at least 10% predicted fraction for that given cell type (Source Data File—Fig. 2f). g Changes in feature attribution weights for select genes (x-axis) indicating proximal convoluted tubule (PCT) epithelial cell fractions shown across different time points (y-axis) following IRI (Source Data File—Fig. 2g). h Box plots of feature attribution weights (x-axis) for genes (y-axis) indicative of select cell types predicted to be present at the 6-week post-IRI (n = 1) timepoint. Sample sizes represent individual spatial capture spots with at least 10% predicted fraction for that given cell type (Source Data File—Fig. 2h). For scale bars in c and e, these represent the fraction (range 0–1) a given spatial coordinate is predicted to be composed of a given cell type. For boxplots in f and h, the center line, box limits and box whiskers correspond to the median, first and third quartiles, and the 1.5x interquartile range, respectively. Individual data points are superimposed over each boxplot.

