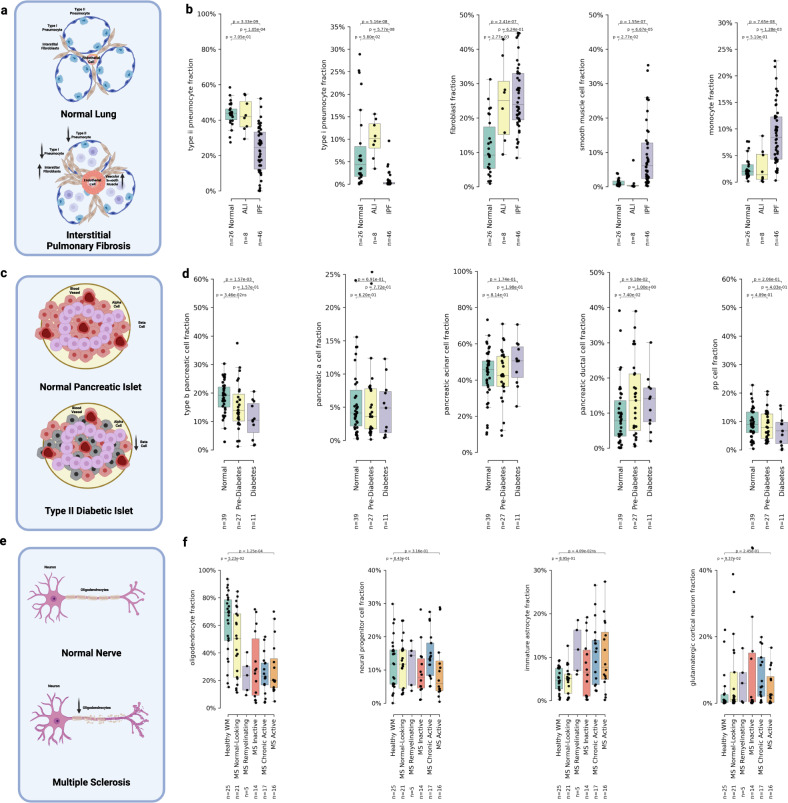
Fig. 4. UniCell resolves expected pathophysiological changes in cellular fractions from Bulk RNA-sequencing data.
a Visualization summarization basic pathophysiology of interstitial pulmonary fibrosis and potential shifts in cell type fractions. b Box plots of cell type fractions predicted by UniCell Deconvolve Base (UCDBase) for key lung cell types (y-axis) stratified by disease state (x-axis) (Source Data File—Fig. 4b). c Visualization summarization basic pathophysiology of type ii diabetes and potential shifts in cell type fractions. d Box plots of cell type fractions predicted by UCDBase for key pancreatic cell types (y-axis) stratified by disease state (x-axis) (Source Data File—Fig. 4d). e Visualization summarization basic pathophysiology of multiple sclerosis and potential shifts in cell type fractions. f Box plots of cell type fractions predicted by UCDBase for key brain white matter cell types (y-axis) stratified by disease state (x-axis) (Source Data File—Fig. 4f). For all boxplots shown in b, d, and f, the center line, box limits and box whiskers correspond to the median, first and third quartiles, and the 1.5x interquartile range, respectively. Sample sizes for each stratification across all dot plots are shown below x-axis labels, with individual data points being patient samples and superimposed over each boxplot. For all boxplots shown in b, d, and f, P-values indicate the significance of difference between groups evaluated using an unpaired two-sided Wilcoxon rank sum test, with Benjamini-Hochberg correction for multiple comparisons.

