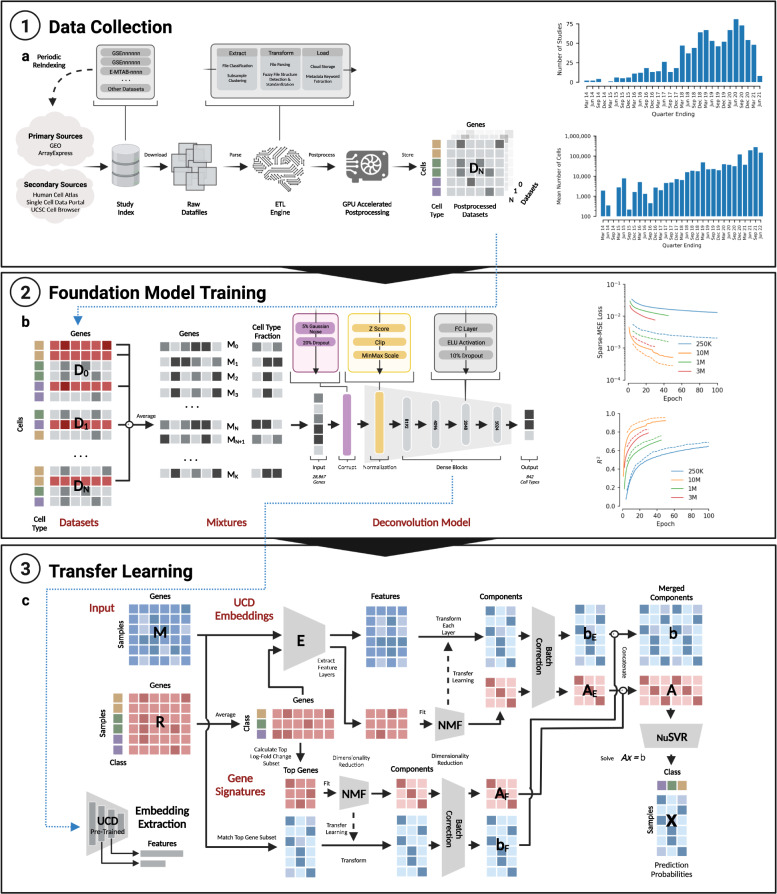
Fig. 6. Summary of UniCell data collection, training mixture generation, foundation model architecture, and transfer learning strategy.
a Depicted on the left is a flow chart summarizing the training data collection strategy. Candidate studies are first indexed from several primary and secondary data sources. Raw data is downloaded from respective source locations, and processed through an ETL engine where the output represents a standardized single cell count matrix. GPU accelerated post processing is performed, resulting in a normalized single cell expression profile. The number of studies indexed and total number of cells profiled (y-axis) is shown as a histogram on the right, within 3 month interval buckets (x-axis). b Each normalized single cell expression profile is utilized to form training data in the form of single cell mixtures, whereby random subsets of cells from across studies are selected (see flow chart on left) and averaged together to create mixed expression vectors of known cell type fractions. Expression vectors are fed into a deep learning model trained to predict the known cell type fraction. The basic elements and structure of the UniCell Deconvolve Base model are shown in the flow chart. On the right, an overview of the training process is shown. The y-axis represents either model loss or coefficient of determination (R2) while the x-axis represents training epoch, where one epoch represents a single full cycle through training dataset. Each colored line corresponds to a different size of training dataset (250 K, 1 M, 3 M, or 10 M synthetic mixtures). Solid lines represent model performance on the training dataset, while dashed lines represent model performance on test dataset. c Users have the option of supplying a contextualized reference profile, which is used in conjunction with embeddings obtained from UCD Base acting as a universal cell state feature extractor. A regression model is then trained using processed embeddings, yielding a fine-tuned transfer learning model applicable to user-specific use cases. Details of the transfer learning model architecture are shown in the corresponding flow chart.

