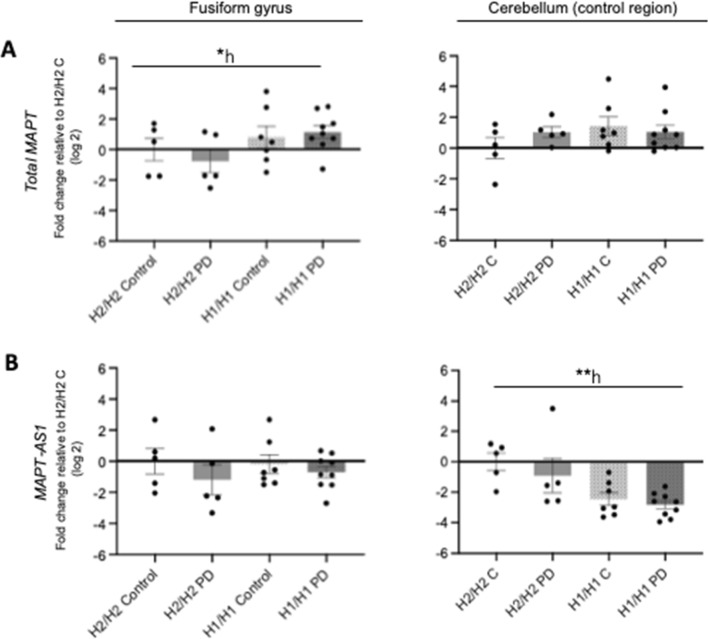
Fig. 2.
Influence of MAPT haplotype and disease status on MAPT and MAPT-AS1 mRNA expression. Bar graphs showing the effect of MAPT haplotype (H1/H1, H2/H2) and diseases status (PD, controls) on the mRNA expression of total MAPT (A) and MAPT-AS1 (B) measured by qPCR in human brain samples of the cortex of fusiform gyrus and the cortex of cerebellum. For analysis of the MAPT haplotype effects, PD cases and controls were combined, and vice versa for analysis of the disease status. Data are fold change (log2, mean ± SEM) relative to H2/H2 controls (H2/H2 C). The total independent sample size is: H2/H2 Control n = 5, H2/H2 PD n = 5, H1/H1 Control n = 7, H1/H1 PD n = 9). Two-way ANOVA (haplotype × disease status), followed by Tukey’s post-hoc test: *P < 0.05; **P < 0.01; *h, significant effect of haplotype

