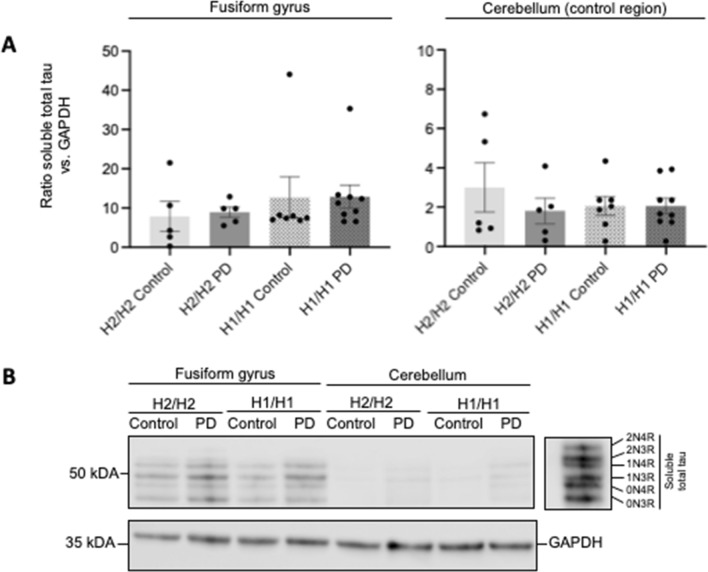
Fig. 3.
Effect of MAPT haplotype and disease status on soluble tau protein levels. A Bar graphs showing the effect of MAPT haplotypes (H1/H1, H2/H2) and diseases status (PD, control) on soluble total tau protein levels in human brain samples of cortex of fusiform gyrus and the cortex of cerebellum. For analysis of the MAPT haplotype effects, PD cases and controls were combined, and vice versa for analysis of the disease status. Data are protein quantity (mean ± SEM) relative to GAPDH and normalized to an inter-run calibration consisting of pooled protein samples. Two-way ANOVA (haplotype × disease status) showed no significant group differences. B Representative Western blots for soluble total tau with GAPDH as reference protein. The six tau isoforms were identified by comparison to a recombinant tau ladder. Each group is represented with 1 donor in each blot. The total independent sample size is: H2/H2 Control n = 5, H2/H2 PD n = 5, H1/H1 Control n = 7, H1/H1 PD n = 9). Full length Western blots are shown in Additional file 2: Figure S2

