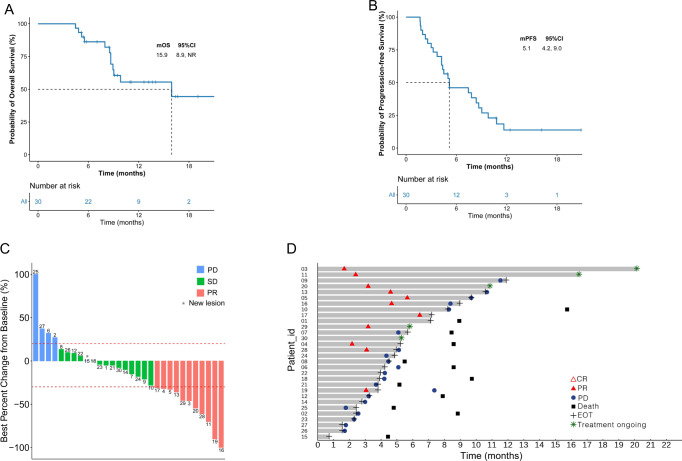
Fig. 2. Kaplan-Meier curves and characteristics of objective response in the study.
A Kaplan-Meier estimates of overall survival (n = 30). B Kaplan-Meier estimates of progression-free survival by RECISTv1.1 (n = 30). C Change of target lesion in tumor size from baseline to best response (n = 30). D Swimming chart showing the treatment results (n = 30), the length of each bar represents the duration of treatment of each patient in the IIT population. Source data are provided as a Source Data file. PR partial response, SD Supplementary Table disease, PD progressive disease.

