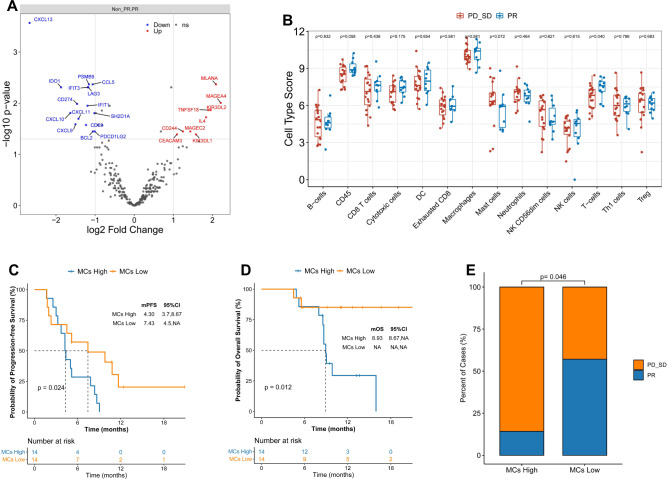
Fig. 4. Identification of differentially expressed genes and immune cell profile analyses in responders and non-responders.
A Transcriptome analysis on differential expression between responders (n = 10) and non-responders (n = 18), DESeq2 was provided to perform differential expression testing using the Wald test, multiple testing was adjusted using Benjamini and Hochberg method. B The abundance of predefined 14 immune cells composition between responders (n = 10) and non-responders (n = 18), box plots are indicated in terms of minima, maxima, centre, bounds of box and whiskers (interquartile range value), and percentile in the style of Tukey. Wilcoxon test was used to determine the statistical significance between subgroups. The adverse predictive value of tumor-infiltrating MCs in immuno-chemotherapy, p-values were based on a two-sided log-rank test for survival analysis. E Higher tumor-infiltrating MCs in immuno-chemotherapy presented worse ORR, 2 patients achieved PR in the high (median) tumor-infiltrating MCs group (n = 14), and 8 patients achieved PR in the low (median) tumor-infiltrating MCs group (n = 14). Fisher’s exact test was used to determine the statistical significance between the two groups. Source data are provided as a Source Data file.

