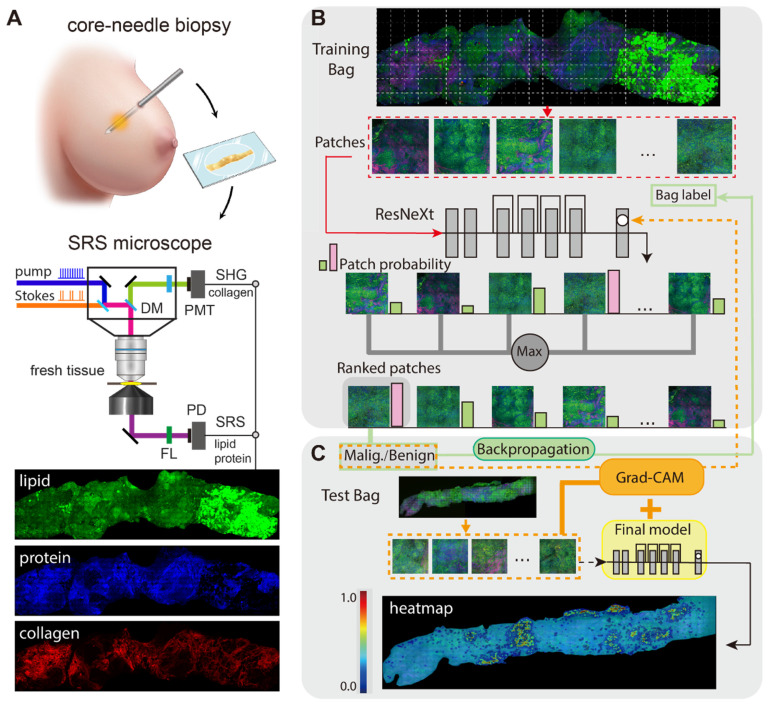
Figure 1.
Schematics of the experimental design. (A) Imaging breast core-needle biopsy with SRS microscopy, generating distributions of lipid, protein and collagen fibers. DM: dichroic mirror; PD: photodiode; PMT: photomultiplier tube; FL: optical filter. (B) Implementation of the multi-instance learning (MIL) algorithm. The whole-slide SRS image as the training bag was sliced into small patches, and sent into ResNeXt model to provide the ranking result based on the output probability (pink and green bars). Max pooling selected the highest score as the bag's output probability to back-propagation for model optimization (green line). (C) Implementation of Grad-CAM algorithm for heatmap visualization.

