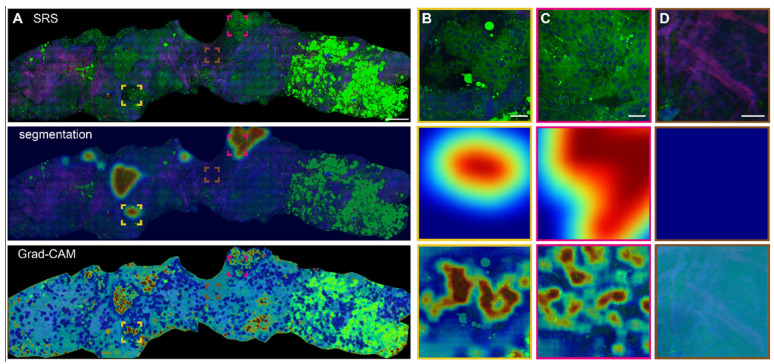
Figure 7.
Heatmap activation and segmentation of breast CNB imaged with SRS. (A) A whole slide image of a representative breast core needle biopsy, with the overlayed heatmap activation using Grad-CAM and semantic segmentation to identify the cancerous regions. (B-C) Magnified areas with highly activated malignancy. (D) Magnified non-cancer area rich in collagen. The red and blue colors of the heatmap correspond to high and low probabilities of cancer, respectively. Scale bars: (A) 600 µm; (B-D) 60 µm.

