Figure 2.
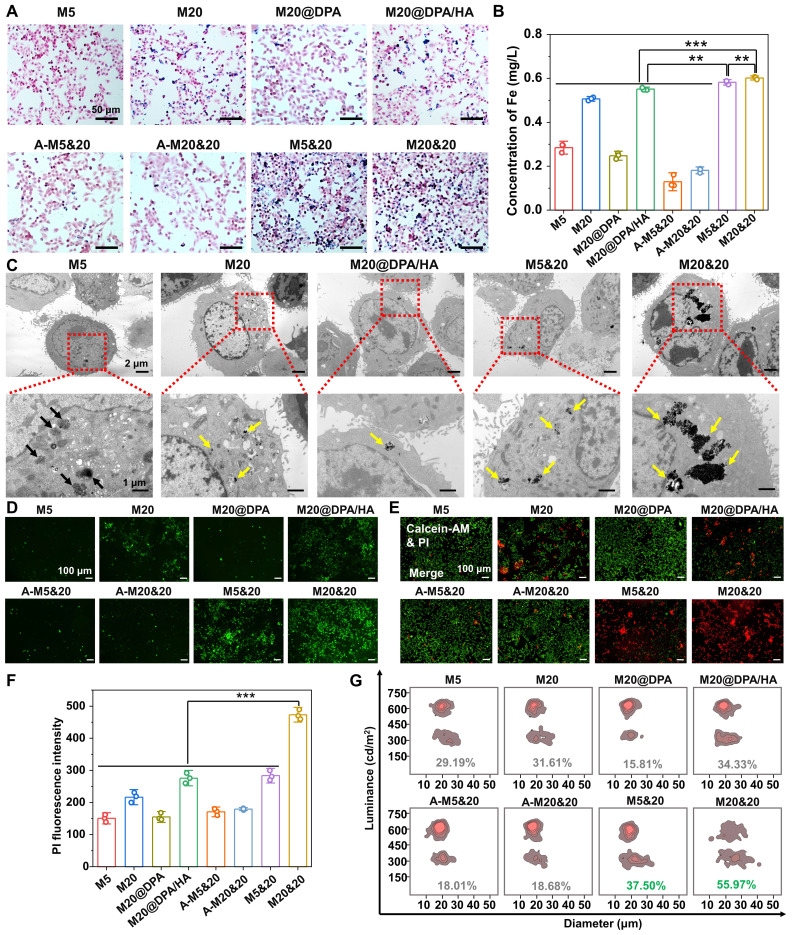
Controlled intracellular aggregation and killing effect of MNPs in 4T1 cells. Cellular uptake (A) and intracellular Fe concentrations (B) of MNPs by Prussian blue staining and ICP-OES analysis after 24 h incubation. The scale bars are 50 μm. (C) TEM observation of intracellular accumulation after 24 h treatment with various MNPs. Black arrows: small size MNPs in endosome/lysosome, yellow arrows: intracellular aggregation of MNPs. The scale bars are 1 and 2 μm, respectively. (D) Generation of ROS after 24 h co-incubation with different MNPs under AMF (20 min) by fluorescent probe staining. Scale bars: 100 μm. (E) Live/dead staining with calcein acetoxymethyl ester (calcein-AM) and propidium iodide (PI) of cells after co-incubated with different MNPs under AMF. Scale bars: 100 μm (F) Fluorescence intensity of PI-stained 4T1 cells after being treated by various MNPs under AMF. (G) Dead cell ratio of different treatments by cell counting apparatus with trypan blue staining. ** P < 0.01, *** P < 0.001.

