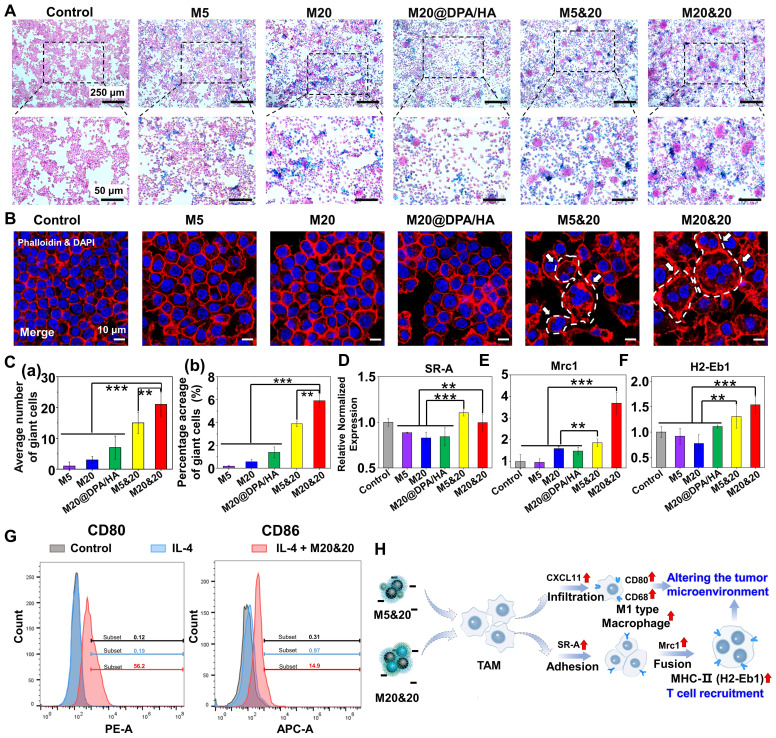
Figure 3.
Immune activation in giant cells formation and macrophage polarization after treatments with different MNPs. (A) Cellular uptake of different MNPs after 24 h incubation on RAW264.7 by Prussian blue staining. Scale bars: 250 and 50 μm, respectively. (B) Detection of giant cell formation in RAW264.7 by cytoskeleton fluorescence staining with phalloidin (red) and DAPI (blue) after different treatments. Scale bars: 10 μm. (C) Average number (a) and percentage acreage (b) of the giant cells, calculated from the Prussian blue and cytoskeleton fluorescence staining in Figure 3A and B. Related gene evaluation for giant cell formation (D & E, SR-A, and Mrc1) and T cells recruitment (F, H2-Eb1) by quantitative real-time polymerase chain reaction (Q-PCR) analysis on RAW264.7 cells after incubation with different MNPs. (G) Flow cytometry analysis of CD80 and CD86 expression on IL-4 pretreated RAW264.7 cells incubated with M20&20. (H) Schematic of giant cell formation, macrophage polarization, and T cell recruitment, after treatment of M5&20 and M20&20, respectively. ** P < 0.01, *** P < 0.001.

