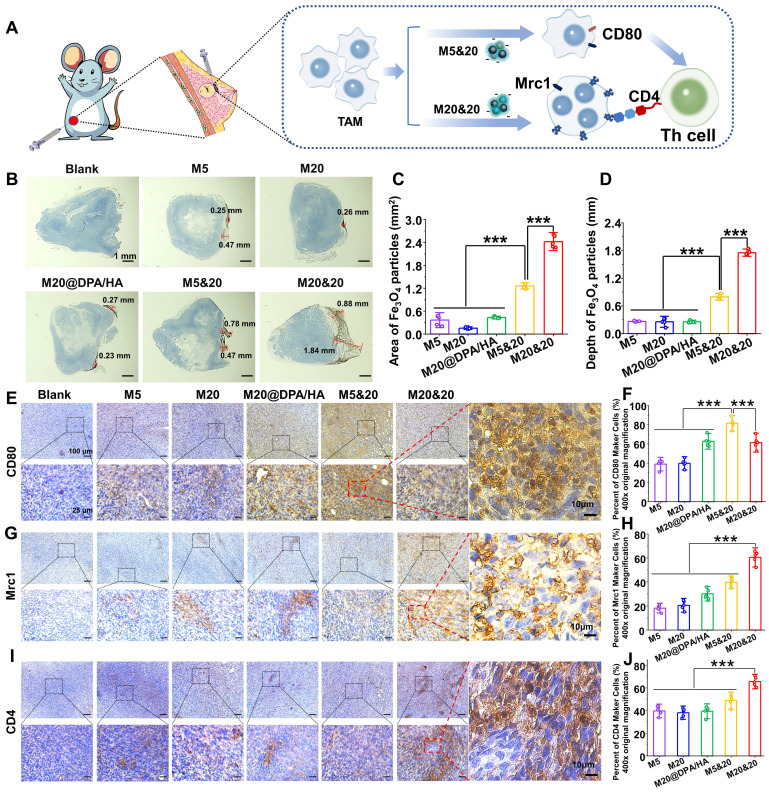
Figure 4.
Detection of the intracellular aggregation induced permeation, retention and immune activation in vivo. (A) Schematic illustration of tumoral administration and possible immune activation process of different MNPs. (B) Permeation and retention of MNPs in tumor sections by DAB-enhanced Prussian staining in different groups. Scale bars: 1 mm. (C) Retention area (mm2) and (D) permeation depth (mm) of varied MNPs in tumor sections, calculated from the images of Figure 4 B. Immunohistochemical staining and positive cell percentages of CD80 (E and F), Mrc1 (G and H) and CD4 (I and J) in tumors treated with different MNPs (400 ×). Scale bars: 100, 25, and 10 μm, respectively. *** P < 0.001.

