Figure 2.
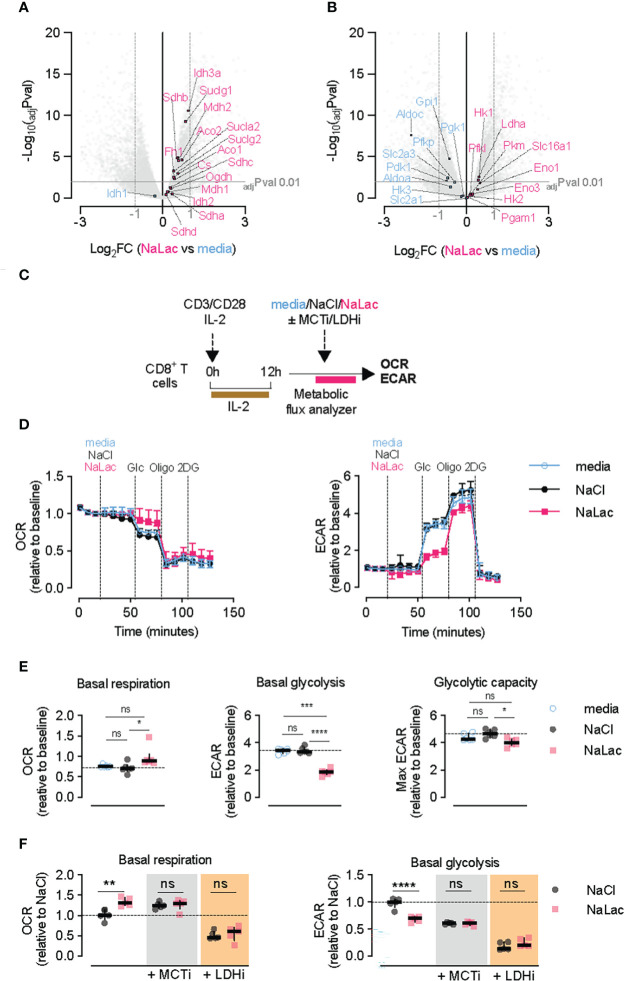
Lactate modulates CD8+ T cell metabolism. (A, B) Volcano plot generated from the RNA-seq data, representing differentially expressed TCA cycle (A) or glycolytic (B) genes in NaLac- relative to media-treated CD8+ T cells, 72 hours after activation. Significantly up- or down-regulated genes are highlighted respectively in pink or light blue. P values were calculated using Student’s t-test and adjusted by false discovery rate (FDR). Significance was set at adjusted p value (adjPval) ≤ 0.01, as indicated by the grey horizontal line. Dashed vertical lines indicate the threshold of differentially expressed transcripts (Log2 fold change ≥ 1 and ≤ -1). (C) Experimental design. CD8+ T cells were purified from mouse splenocytes and activated with anti-CD3/CD28 beads and IL-2 in media. After 12 hours, cells were counted, transferred into a metabolic flux analyzer, and exposed to either 40 mM NaCl, 40 mM sodium lactate (NaLac), or culture media prior to undergoing a glycolytic stress test. (D) Glycolytic stress test of mouse CD8+ T cells 12 hours after activation. Extracellular acidification rate (ECAR) and oxygen consumption rate (OCR) during injection of either media, 40 mM NaCl, or 40 mM NaLac, followed by 10 mM glucose, 1 µM oligomycin (oligo) and 50 mM 2-deoxyglucose (2-DG). ECAR and OCR are normalized to baseline levels. Data are the median and interquartile range of n = 6 independent mice. (E) Basal mitochondrial respiration, basal glycolysis and glycolytic capacity determined from the assay shown in (D). Dotted line: median of NaCl-treated cells. Data is the median and interquartile range of n = 6 independent mouse donors, each assayed as 4 technical replicates. *P<0.01, ***P<0.0005, ****p<0.0001 RM one-way ANOVA with Tukey’s multiple comparisons test. (F) Basal mitochondrial respiration and basal glycolysis determined from cells treated as in (C), and after injection of either NaCl or NaLac with or without addition of 10 nM of the monocarboxylate transporter-1 (MCT-1) inhibitor AZD3985 or 50 μM of the lactate dehydrogenase (LDH) inhibitor GSK2837808A. Data are the median and interquartile range of n = 5 independent mouse donors. **P<0.001, ****p<0.0001 two-way ANOVA with Šídák’s multiple comparisons test. ns, non significant.

