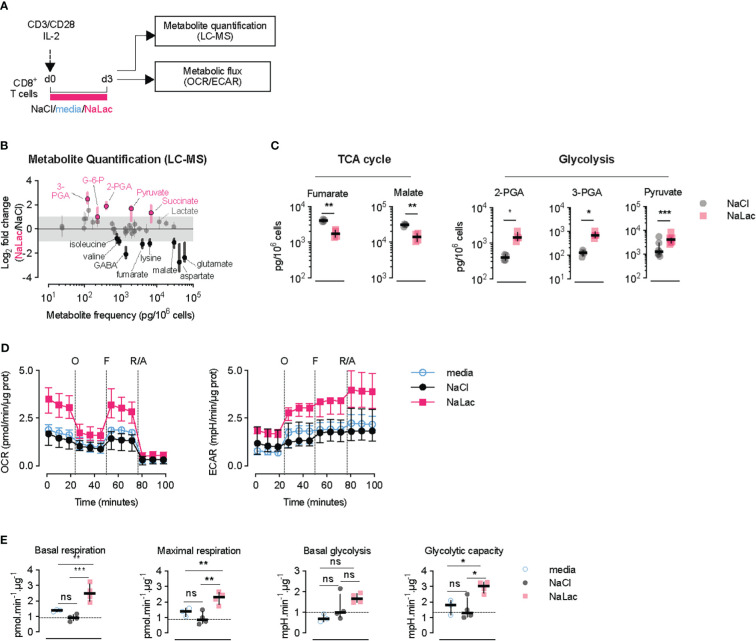
Figure 3.
Early exposure to lactate alters CD8+ T cell metabolism and gene expression. (A) Experimental design. CD8+ T cells were purified from mouse splenocytes and activated with anti-CD3/CD28 beads and IL-2 in the presence of either plain media, or 40 mM NaCl, or 40 mM NaLac for 72 hours. Cells were then analyzed by liquid chromatography-mass spectrometry (LC-MS) and metabolic flux analysis (OCR/ECAR). (B) Metabolic changes after 72 hours-activation of mouse CD8+ T cells in the presence of NaLac compared to NaCl. Metabolites were extracted and quantified by Sugar Phosphate and Gas Chromatography-Mass Spectrometry (GC-MS). Pyruvate levels were determined by colorimetric assay. Data show log2 fold changes between NaLac- and NaCl-treated samples of n = 4 independent mouse donors. Pink and black dots represent significantly increased or decreased metabolite frequency in NaLac- versus NaCl-treated cells, respectively. Grey area: range between 2-fold increase and 2-fold decrease. (C) Paired analysis of significant metabolites from the same assay as in (D), grouped by metabolic pathway (n = 4, with each pair representing an independent mouse donor). Pyruvate levels were determined by a colorimetric assay from n = 7 independent mouse donors. **P<0.01, *P<0.05 two-tailed paired t test. (D) Oxygen consumption rate (OCR) and extracellular acidification rate (ECAR) of CD8+ T cells after 72 hours activation in the presence of 40 mM NaCl, 40 mM NaLac, or plain media. OCR and ECAR were measured during sequential addition of 1 µM oligomycin (oligo), 1.5 µM FCCP, and 100 nM rotenone combined with 1 µM antimycin A (Rot/Ant). OCR and ECAR were normalized to total protein content at the end of assay. Lines represent the median and interquartile range of n = 4 independent mouse donors, each assayed as 4 technical replicates. (E) Basal respiration, maximal respiration, basal glycolysis, and glycolytic capacity determined from the assay shown in (F). Dotted line: median of NaCl-treated (control) cells. *P<0.05, **P<0.001, ***P<0.001 one-way ANOVA with Tukey’s multiple comparison test. ns, non significant.

