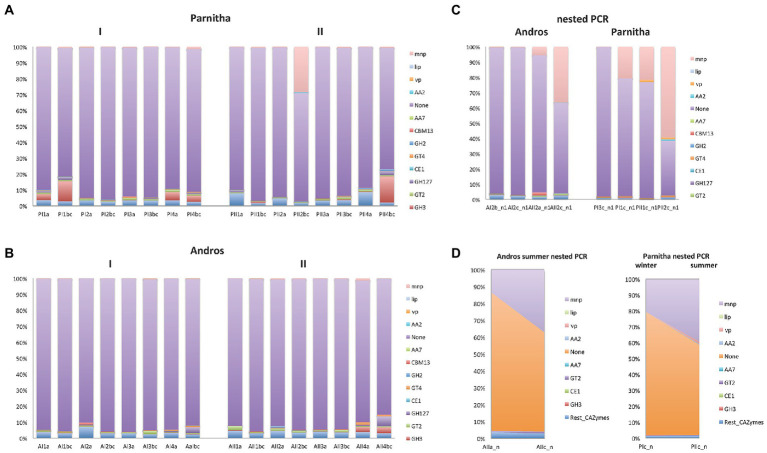
Figure 4.
The distribution of AA2 peroxidases and the most abundant CAZymes in the sampling plots (1,2,3,4), soil depths (a,b,c) and seasons (I = winter, II = summer) of (A) Parnitha and (B) Andros forests. The distribution of the same enzyme sequences obtained by nested PCR reactions are also shown for comparison (C), while the significant increase of AA2 sequences with depth, in both forests, is shown in (D; examples: at summer, with depth, Andros; winter-summer, deeper samples, Parnitha),

