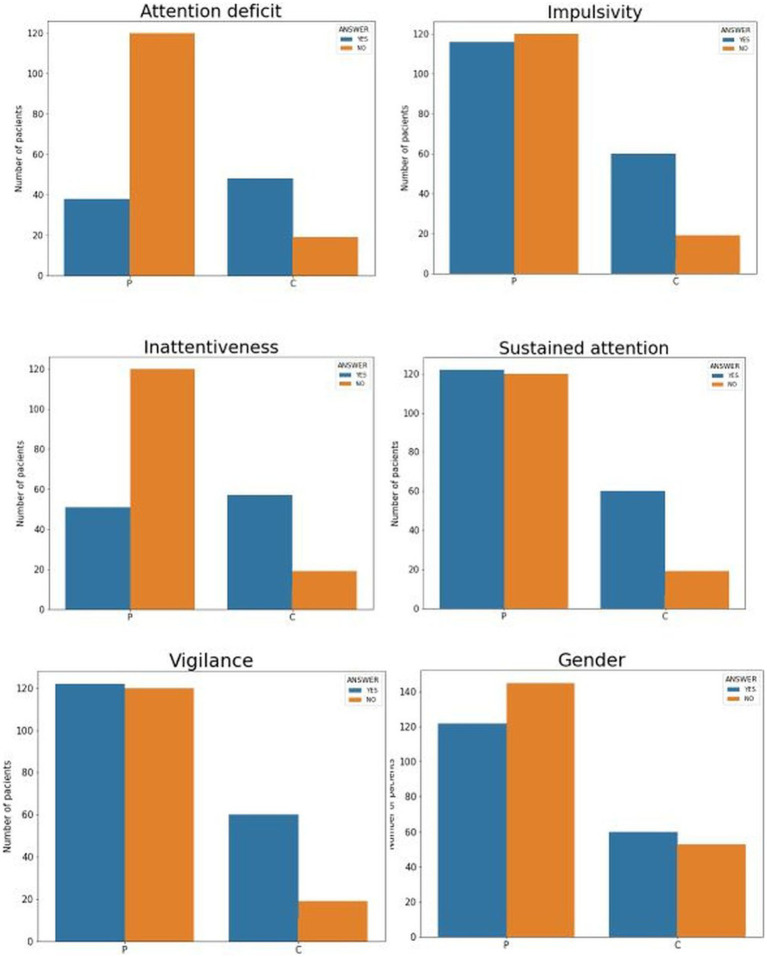
Figure 1.
Graph of the contingency tables by groups and normalized, where each bar corresponds to the percentage of each value by groups. Each drawing represents for each dichotomous variable the group differences, with C being the control group and P the diagnosed group. The following acronyms mean the six dichotomous variables: DAT, attention deficit; INAT, inattentiveness; IMPUL, impulsivity; AT.SOST, sustained attention; VIGIL, vigilance; and finally, Gender.

