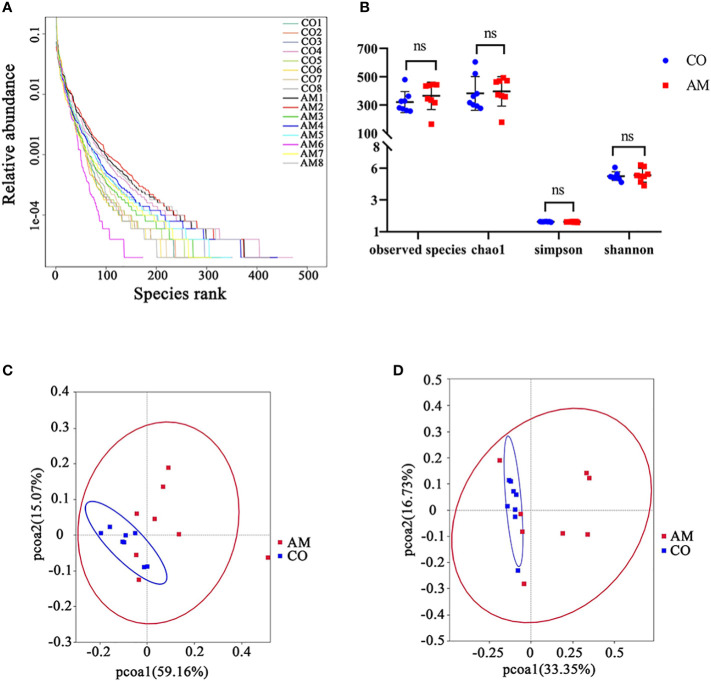
Figure 2.
Diversity analysis of gut microbiota in control and AM groups. (A) Rank-abundance curves. The abscissa position of the extension endpoint of the sample curve was the number of OTU. (B) Boxplot of alpha diversity (Observed species, Chao1, Shannon, and Simpson index) for gut microbiota. Weighted uniFrac PCoA plots (C) and unweighted uniFrac PCoA plots (D). PC1 and PC2 represented the two suspected influencing factors of microbial composition migration. The percentage represented the contribution of principal coordinate components to sample composition differences. The closer the two sample points were, the more similar the species composition of the two samples was. ns, not significantly different.

