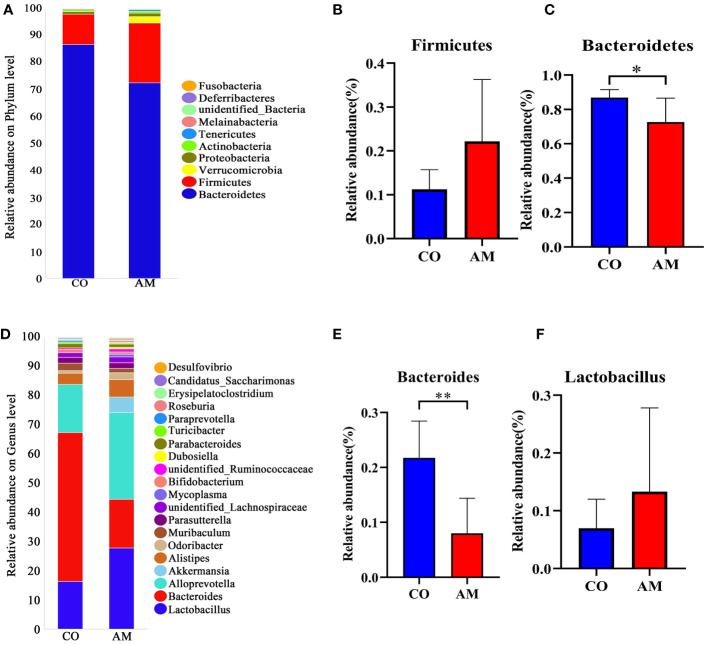
Figure 3.
Composition of gut microbiota in control and AM groups. (A) Composition of species at phylum level. (B) The relative abundance of Firmicutes (n=8 per group). (C) The relative abundance of Bacteroidetes (n=8 per group). (D) Composition of species at genus level. (E) The relative abundance of Bacteroides (n=8 per group). (F) The relative abundance of Lactobacillus (n=8 per group). *, P<0.05, **, P<0.01.

