Figure 4.

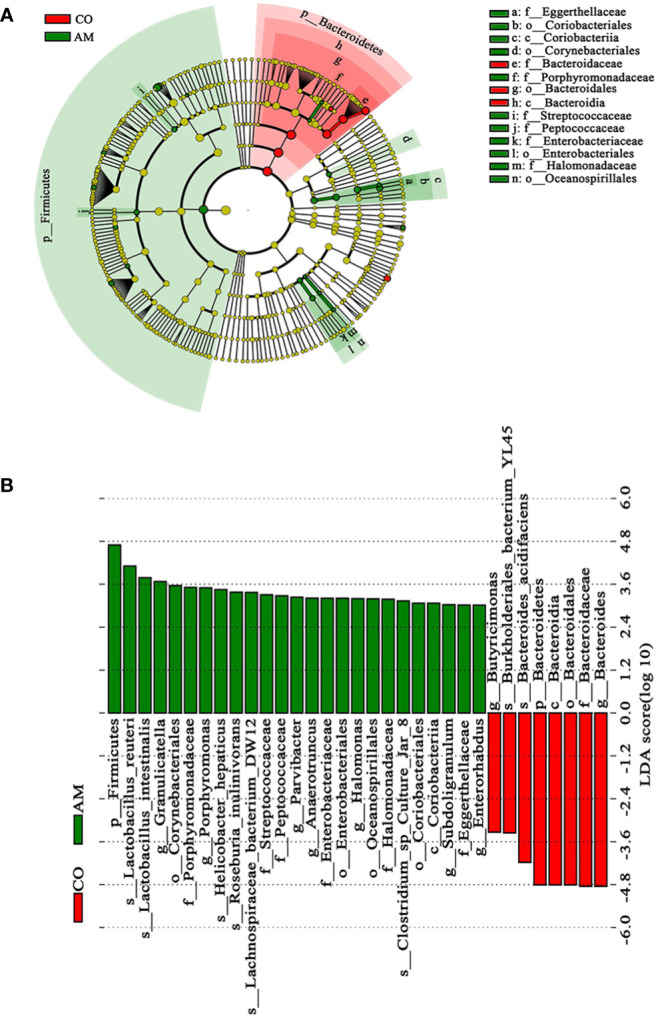
Linear discriminant analysis (LDA) integrated with effect size (LEfSe). (A) Cladogram indicating the phylogenetic distribution of microbiota. (B) The differences in relative abundance between the control and AM groups.

Linear discriminant analysis (LDA) integrated with effect size (LEfSe). (A) Cladogram indicating the phylogenetic distribution of microbiota. (B) The differences in relative abundance between the control and AM groups.