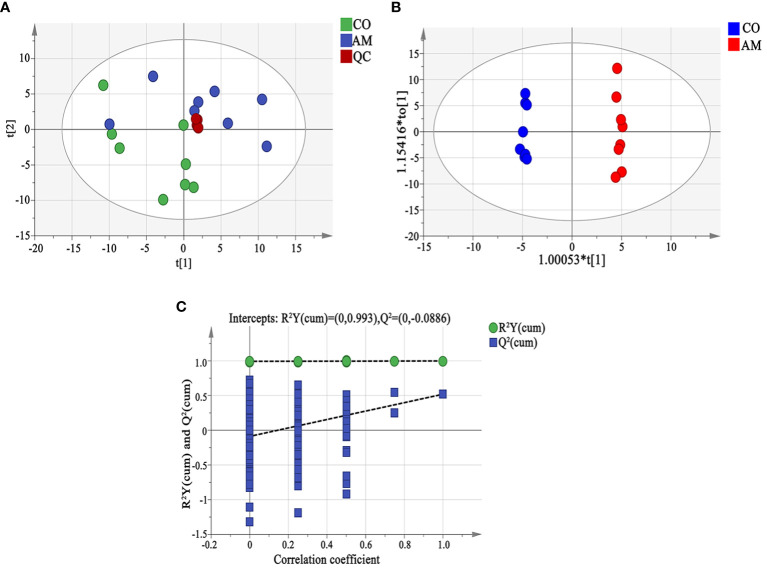
Figure 5.
Fecal metabolomic analysis. (A) Principal component analysis (PCA). The distance of each coordinate point represented the degree of aggregation and dispersion between samples. A close distance indicated high similarity between the samples. PC1 and PC2 represented the contribution values of the first and second principal components, respectively. (B) OPLS-DA analysis displayed the grouped discrimination of the control and AM groups by the first two PCs. (C) OPLS-DA model validation. The abscissa representsed the replacement reservation degree of the replacement test. The ordinate represented the values of R2 (green dot) and Q2 (blue square), and the two dashed lines represented the regression lines of R2 and Q2 . QC, quality control.

