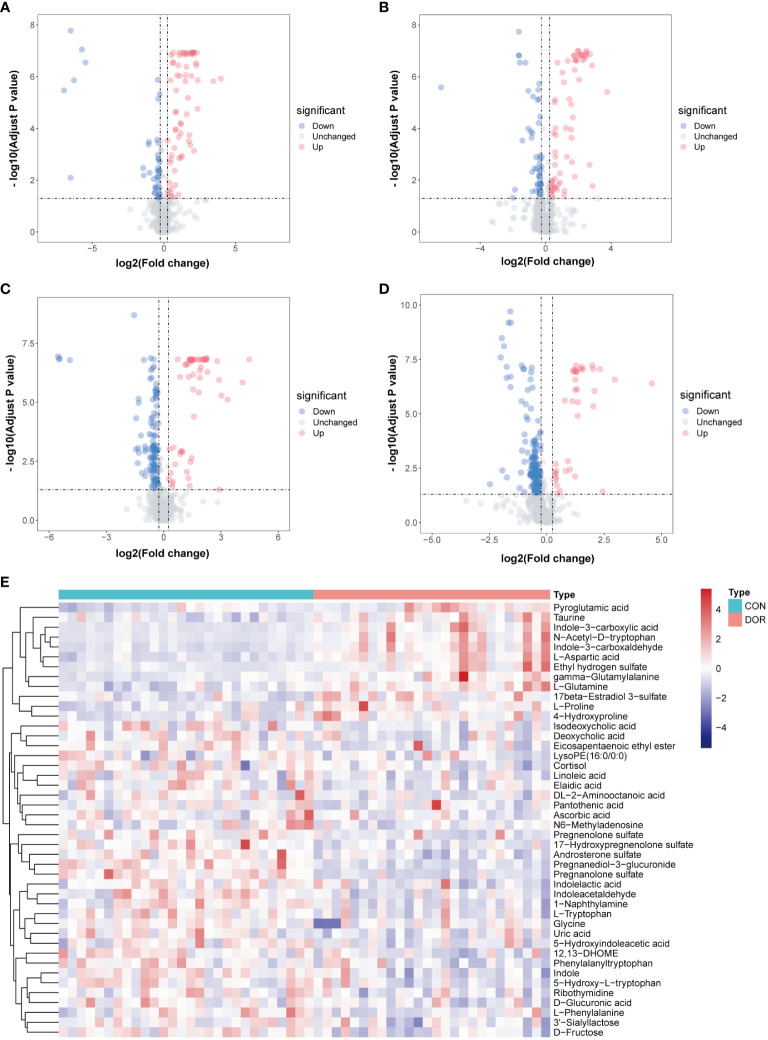
Figure 2.
Volcanic maps under different detection modes show the distribution of different features. The blue dot represents the up regulated features while the red dot represents the down regulated. (A): positive ionization mode in HILIC; (B): negative ionization mode in HILIC; (C): positive ionization mode in RPLC; (D): negative ionization mode in RPLC; (E): Heatmap based on 44 metabolites, unsupervised cluster analysis showed that differential metabolites could distinguish DOR patients from healthy subjects.

